Skip to content
launchroom

Analytics and metrics

See your traffic without a tracking script.

launchroom counts requests where they enter your server. Every service and project gets requests per hour by status, its top paths, referrers and clients, next to the load, logs and alerts of your servers. Nothing to install, nothing to add to your app.
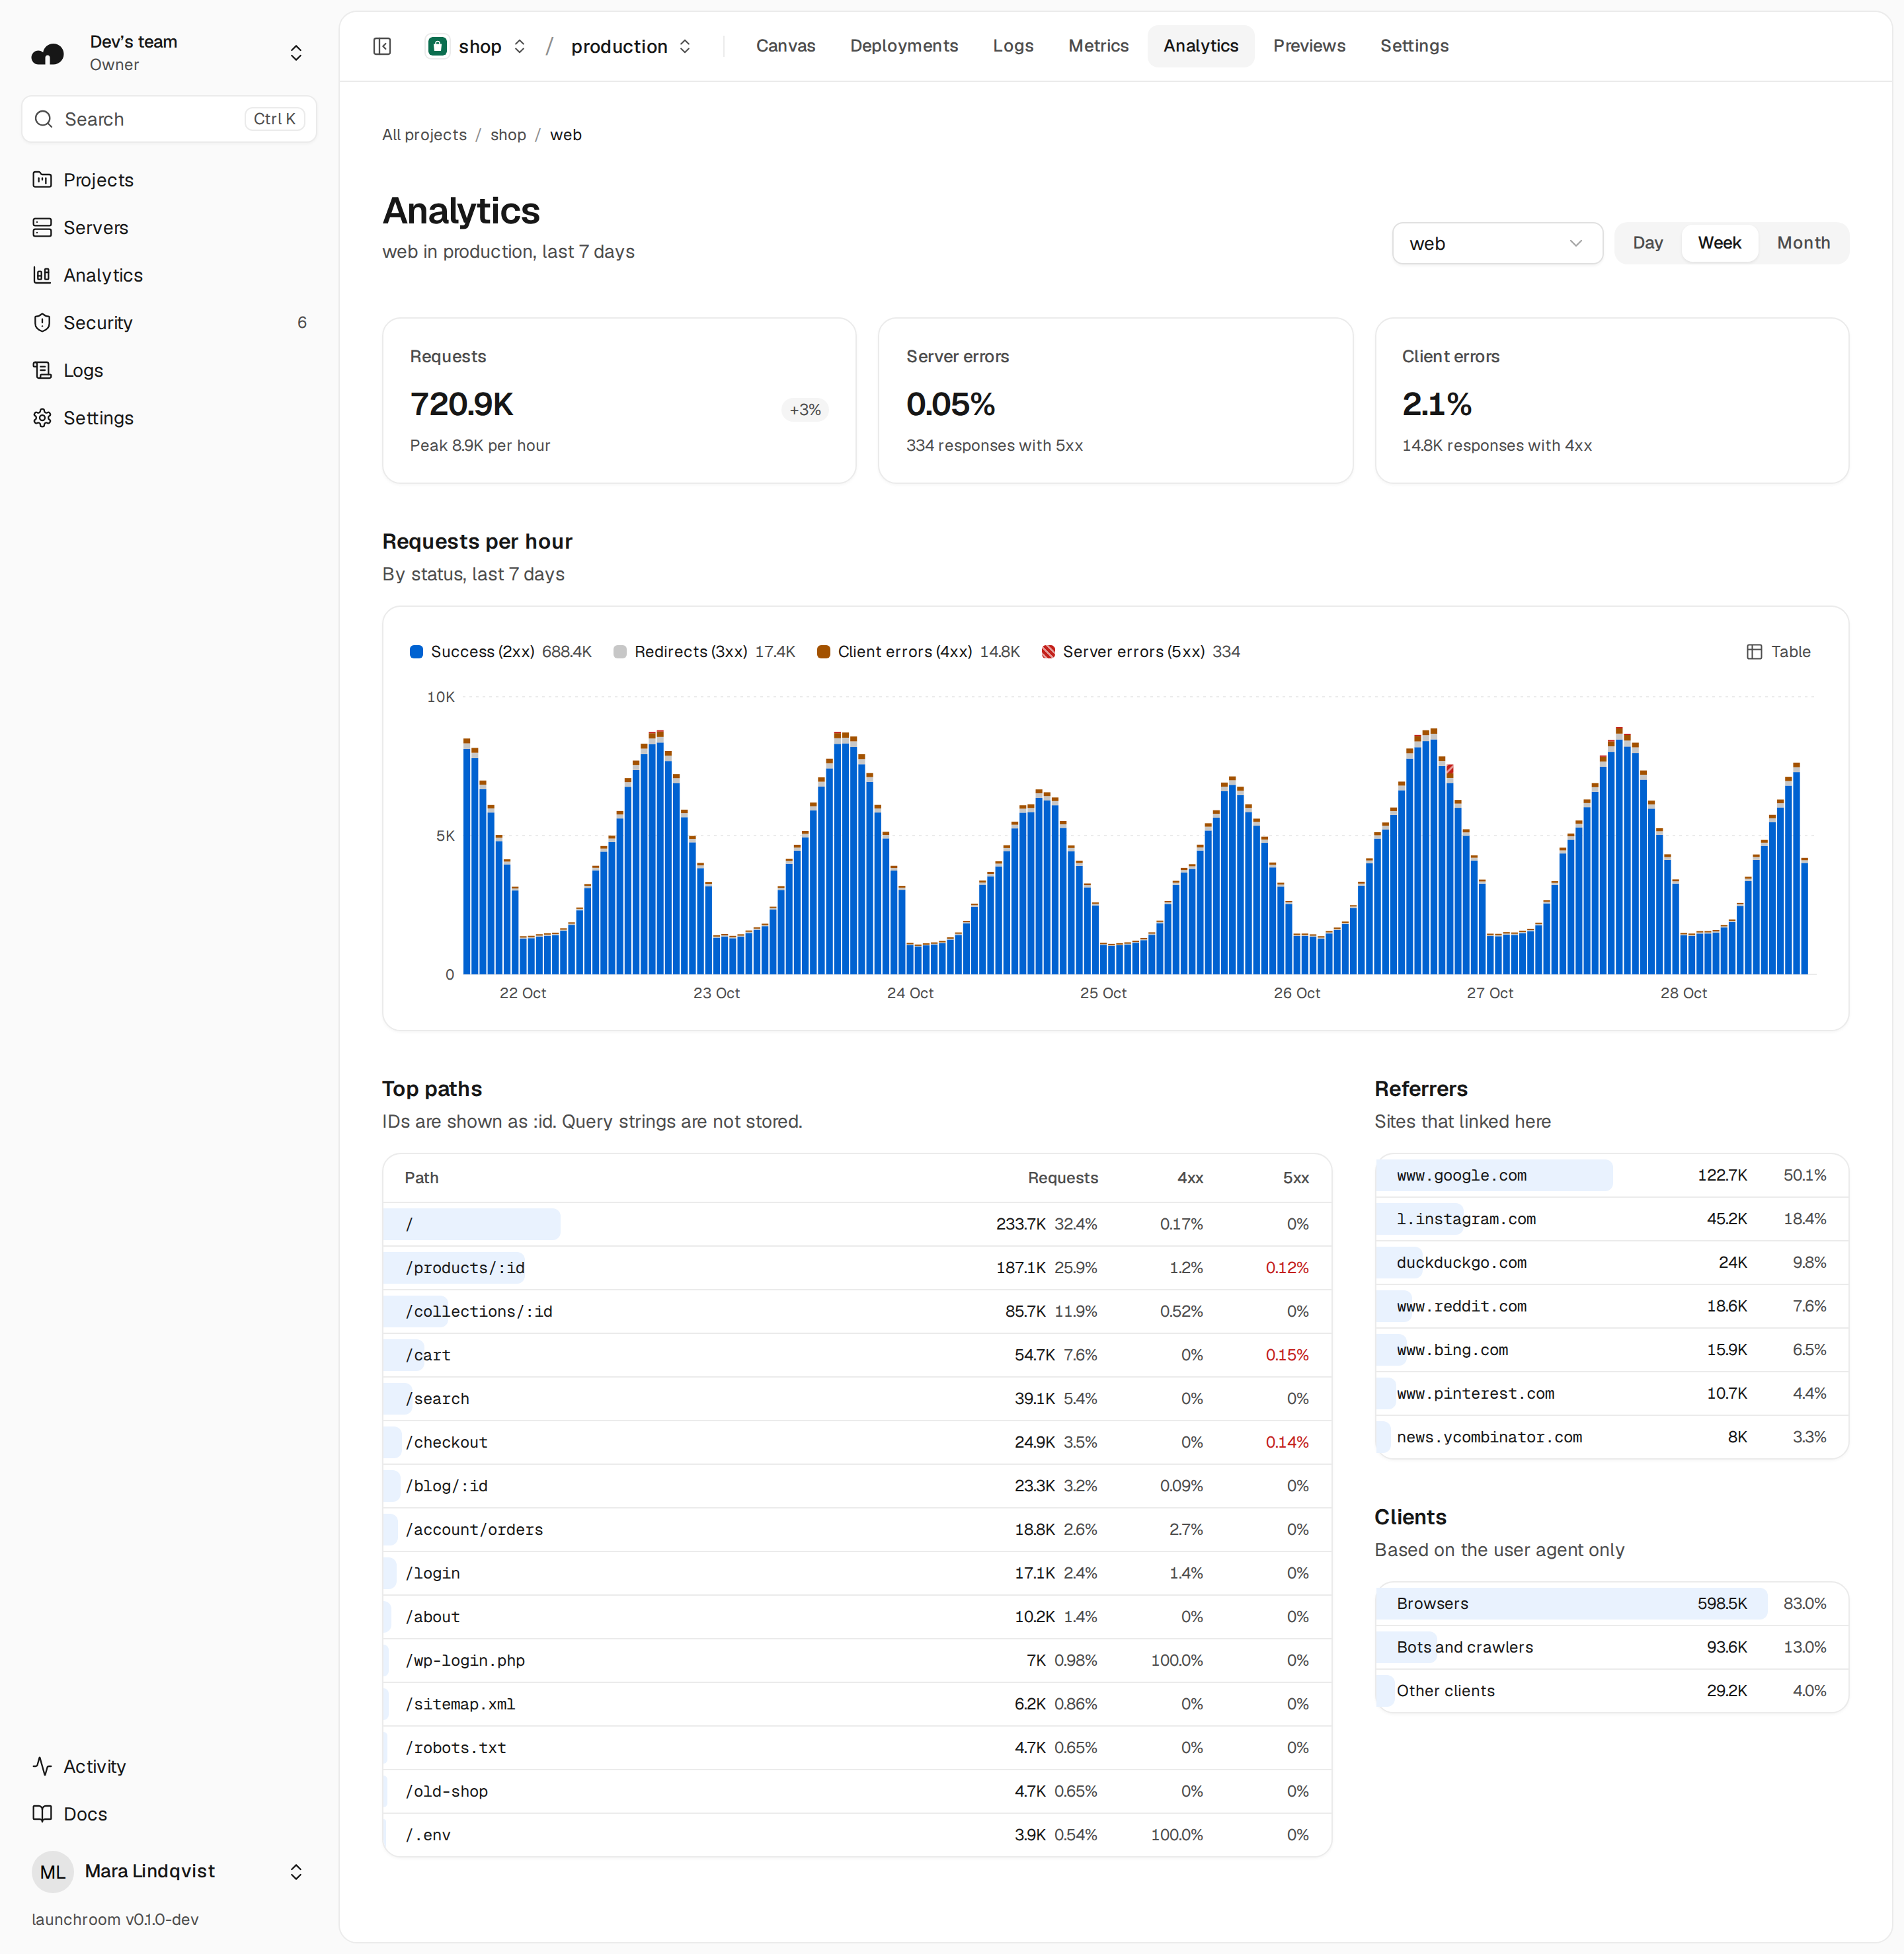
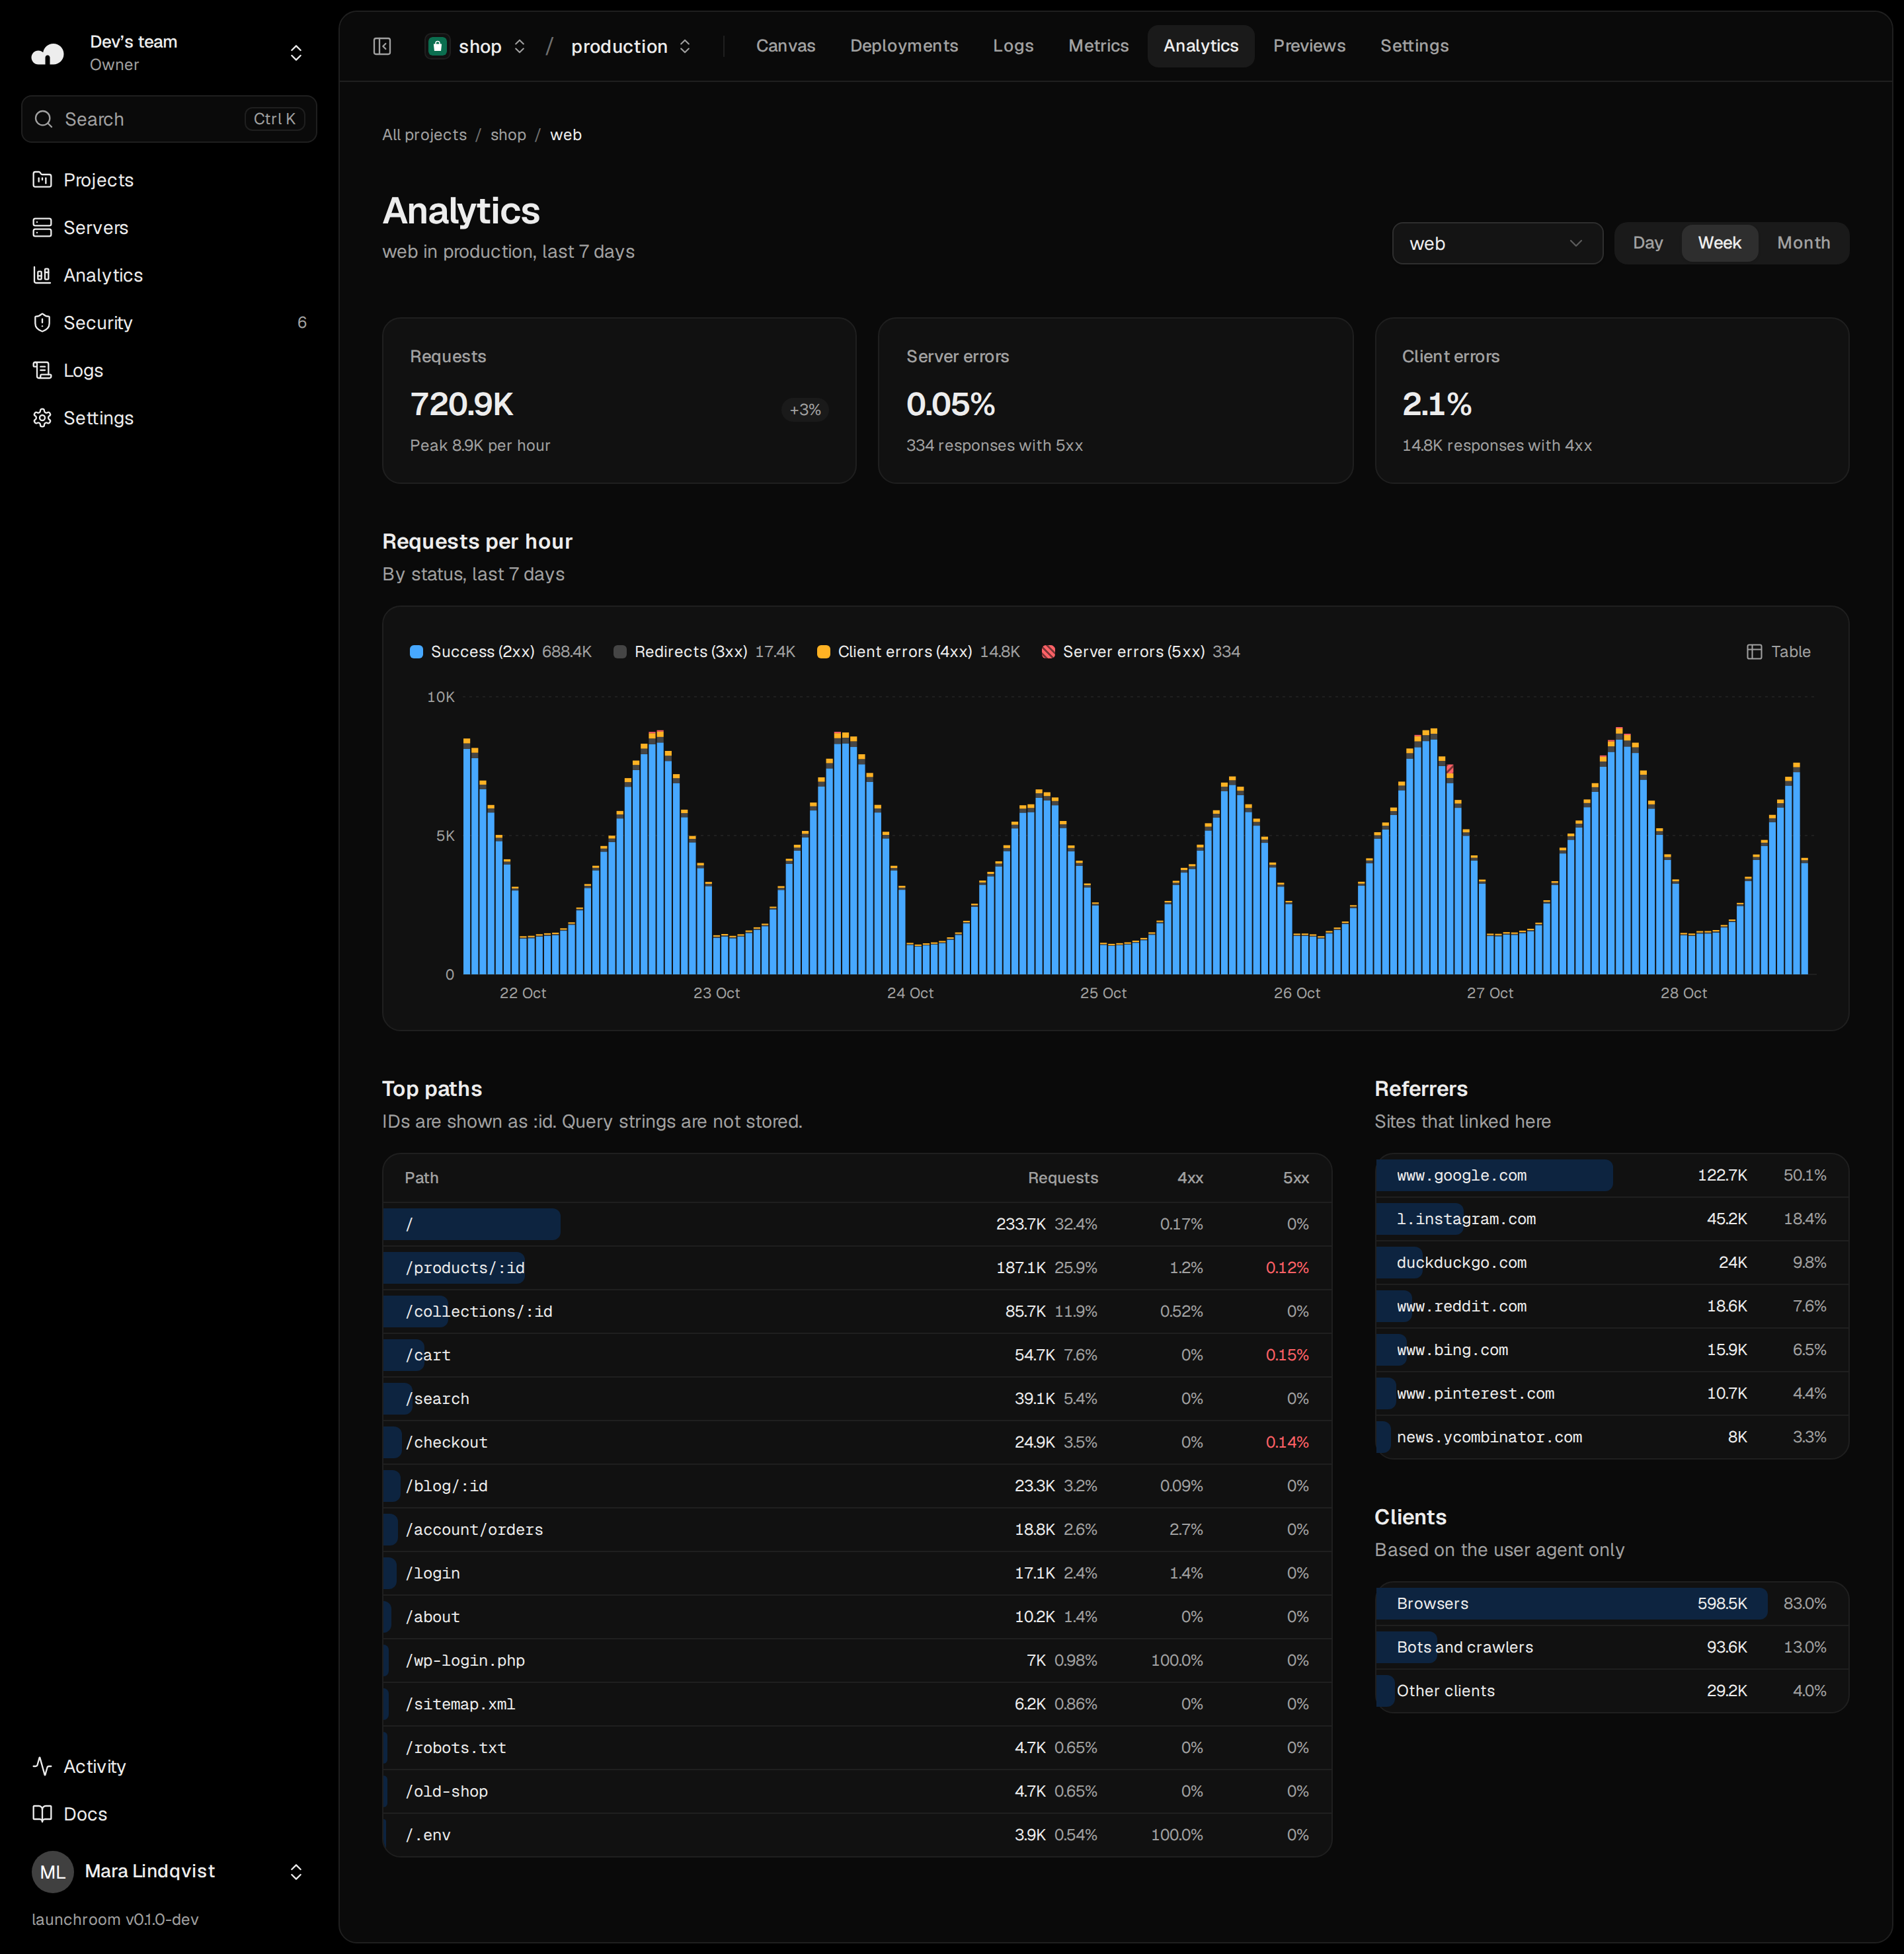
Analytics of the web service in the shop project, last 7 days: 728K requests (up 5 %), 0.07 % server errors and 2.0 % client errors, requests per hour stacked by status with a daily rhythm, top paths such as /products/:id and /checkout with their 4xx and 5xx shares, referrers led by www.google.com and l.instagram.com, and clients split into browsers, bots and other clientsAnalytics of the web service in the shop project, last 7 days: 728K requests (up 5 %), 0.07 % server errors and 2.0 % client errors, requests per hour stacked by status with a daily rhythm, top paths such as /products/:id and /checkout with their 4xx and 5xx shares, referrers led by www.google.com and l.instagram.com, and clients split into browsers, bots and other clients

Privacy

Counted at the edge, without addresses or cookies.

The proxy in front of your apps already sees every request. launchroom reduces each one to its path, status, the host of the referrer and whether it came from a browser or a bot, and counts them per 10 minutes on your server.
  • No IP addresses, locations, cookies or full user agents
  • Query strings are cut before the line leaves the proxy
  • IDs, UUIDs and tokens in paths become :id
  • No script in your pages and nothing to set up
Analytics

Per service

Which paths get the traffic, and which fail.

Open a project’s Analytics tab, or narrow it to one service. A broken route or a bot probing for /wp-login.php stands out in the list.
  • Top paths with their share of 4xx and 5xx responses
  • Referrers by host, and how much traffic comes from bots
  • Day, week or month, with the change against the period before
Analytics of the web service in the shop project, last 7 days: 728K requests (up 5 %), 0.07 % server errors and 2.0 % client errors, requests per hour stacked by status with a daily rhythm, top paths such as /products/:id and /checkout with their 4xx and 5xx shares, referrers led by www.google.com and l.instagram.com, and clients split into browsers, bots and other clientsAnalytics of the web service in the shop project, last 7 days: 728K requests (up 5 %), 0.07 % server errors and 2.0 % client errors, requests per hour stacked by status with a daily rhythm, top paths such as /products/:id and /checkout with their 4xx and 5xx shares, referrers led by www.google.com and l.instagram.com, and clients split into browsers, bots and other clients

Team overview

Every project in one view.

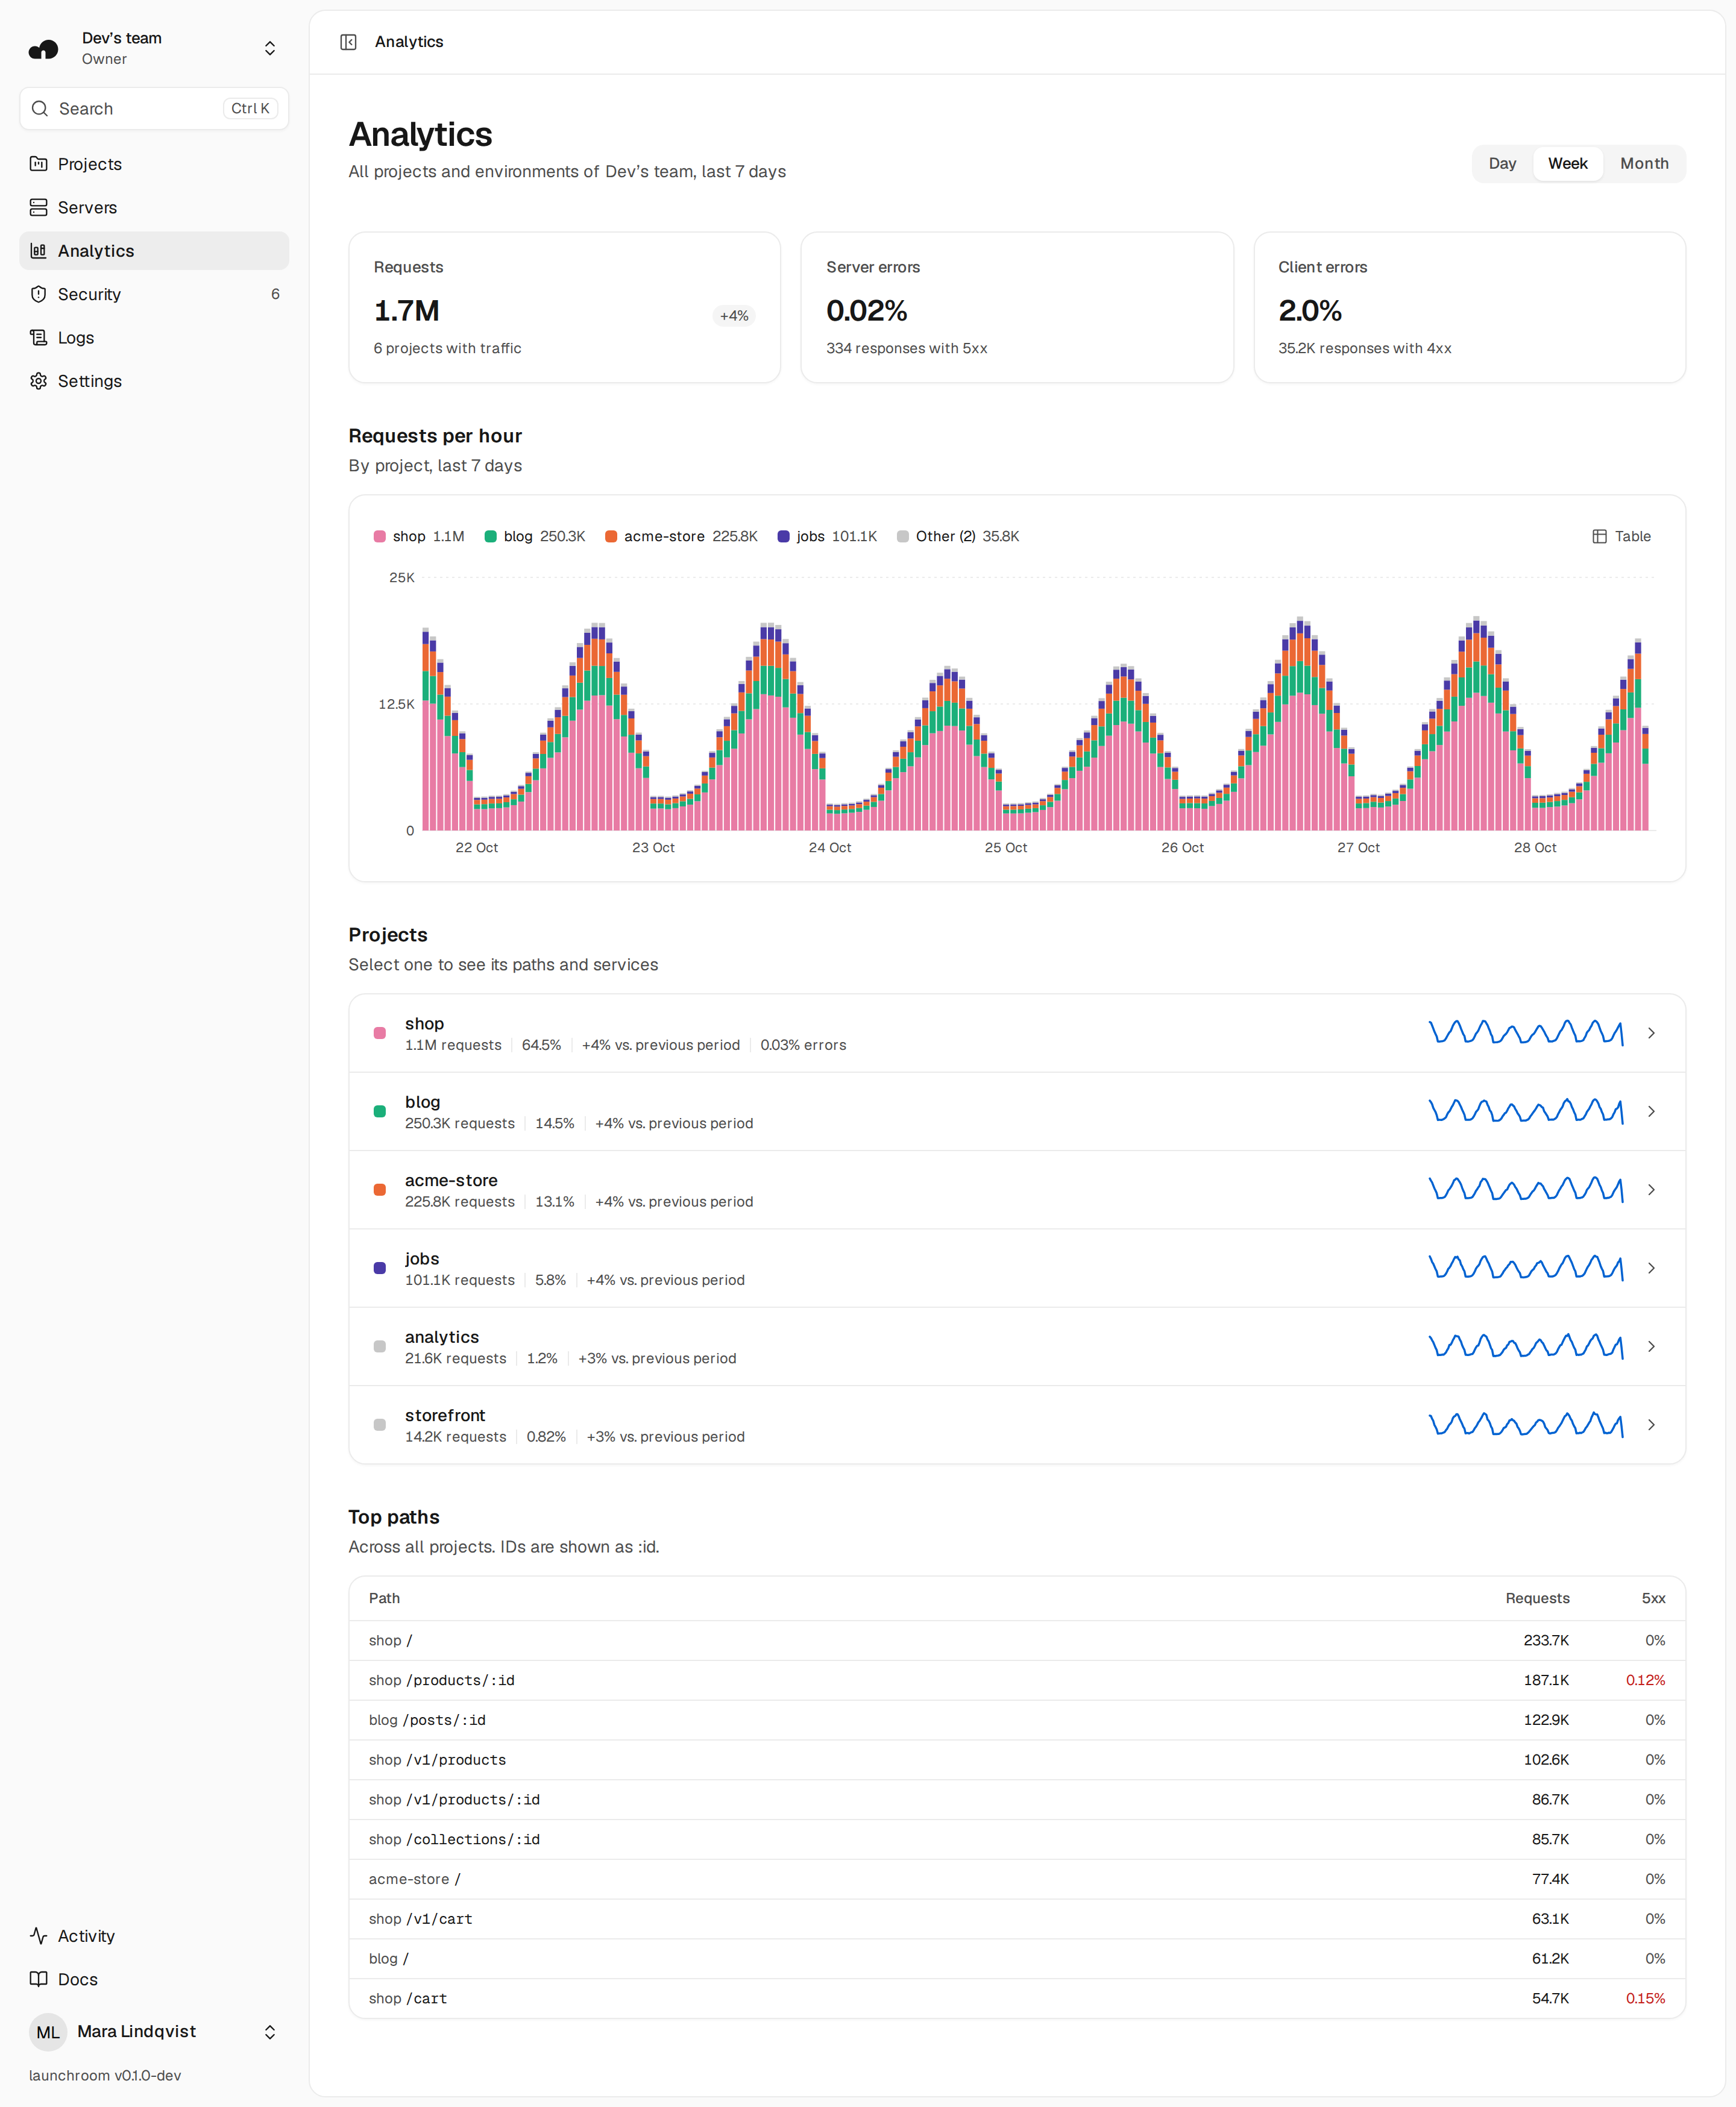
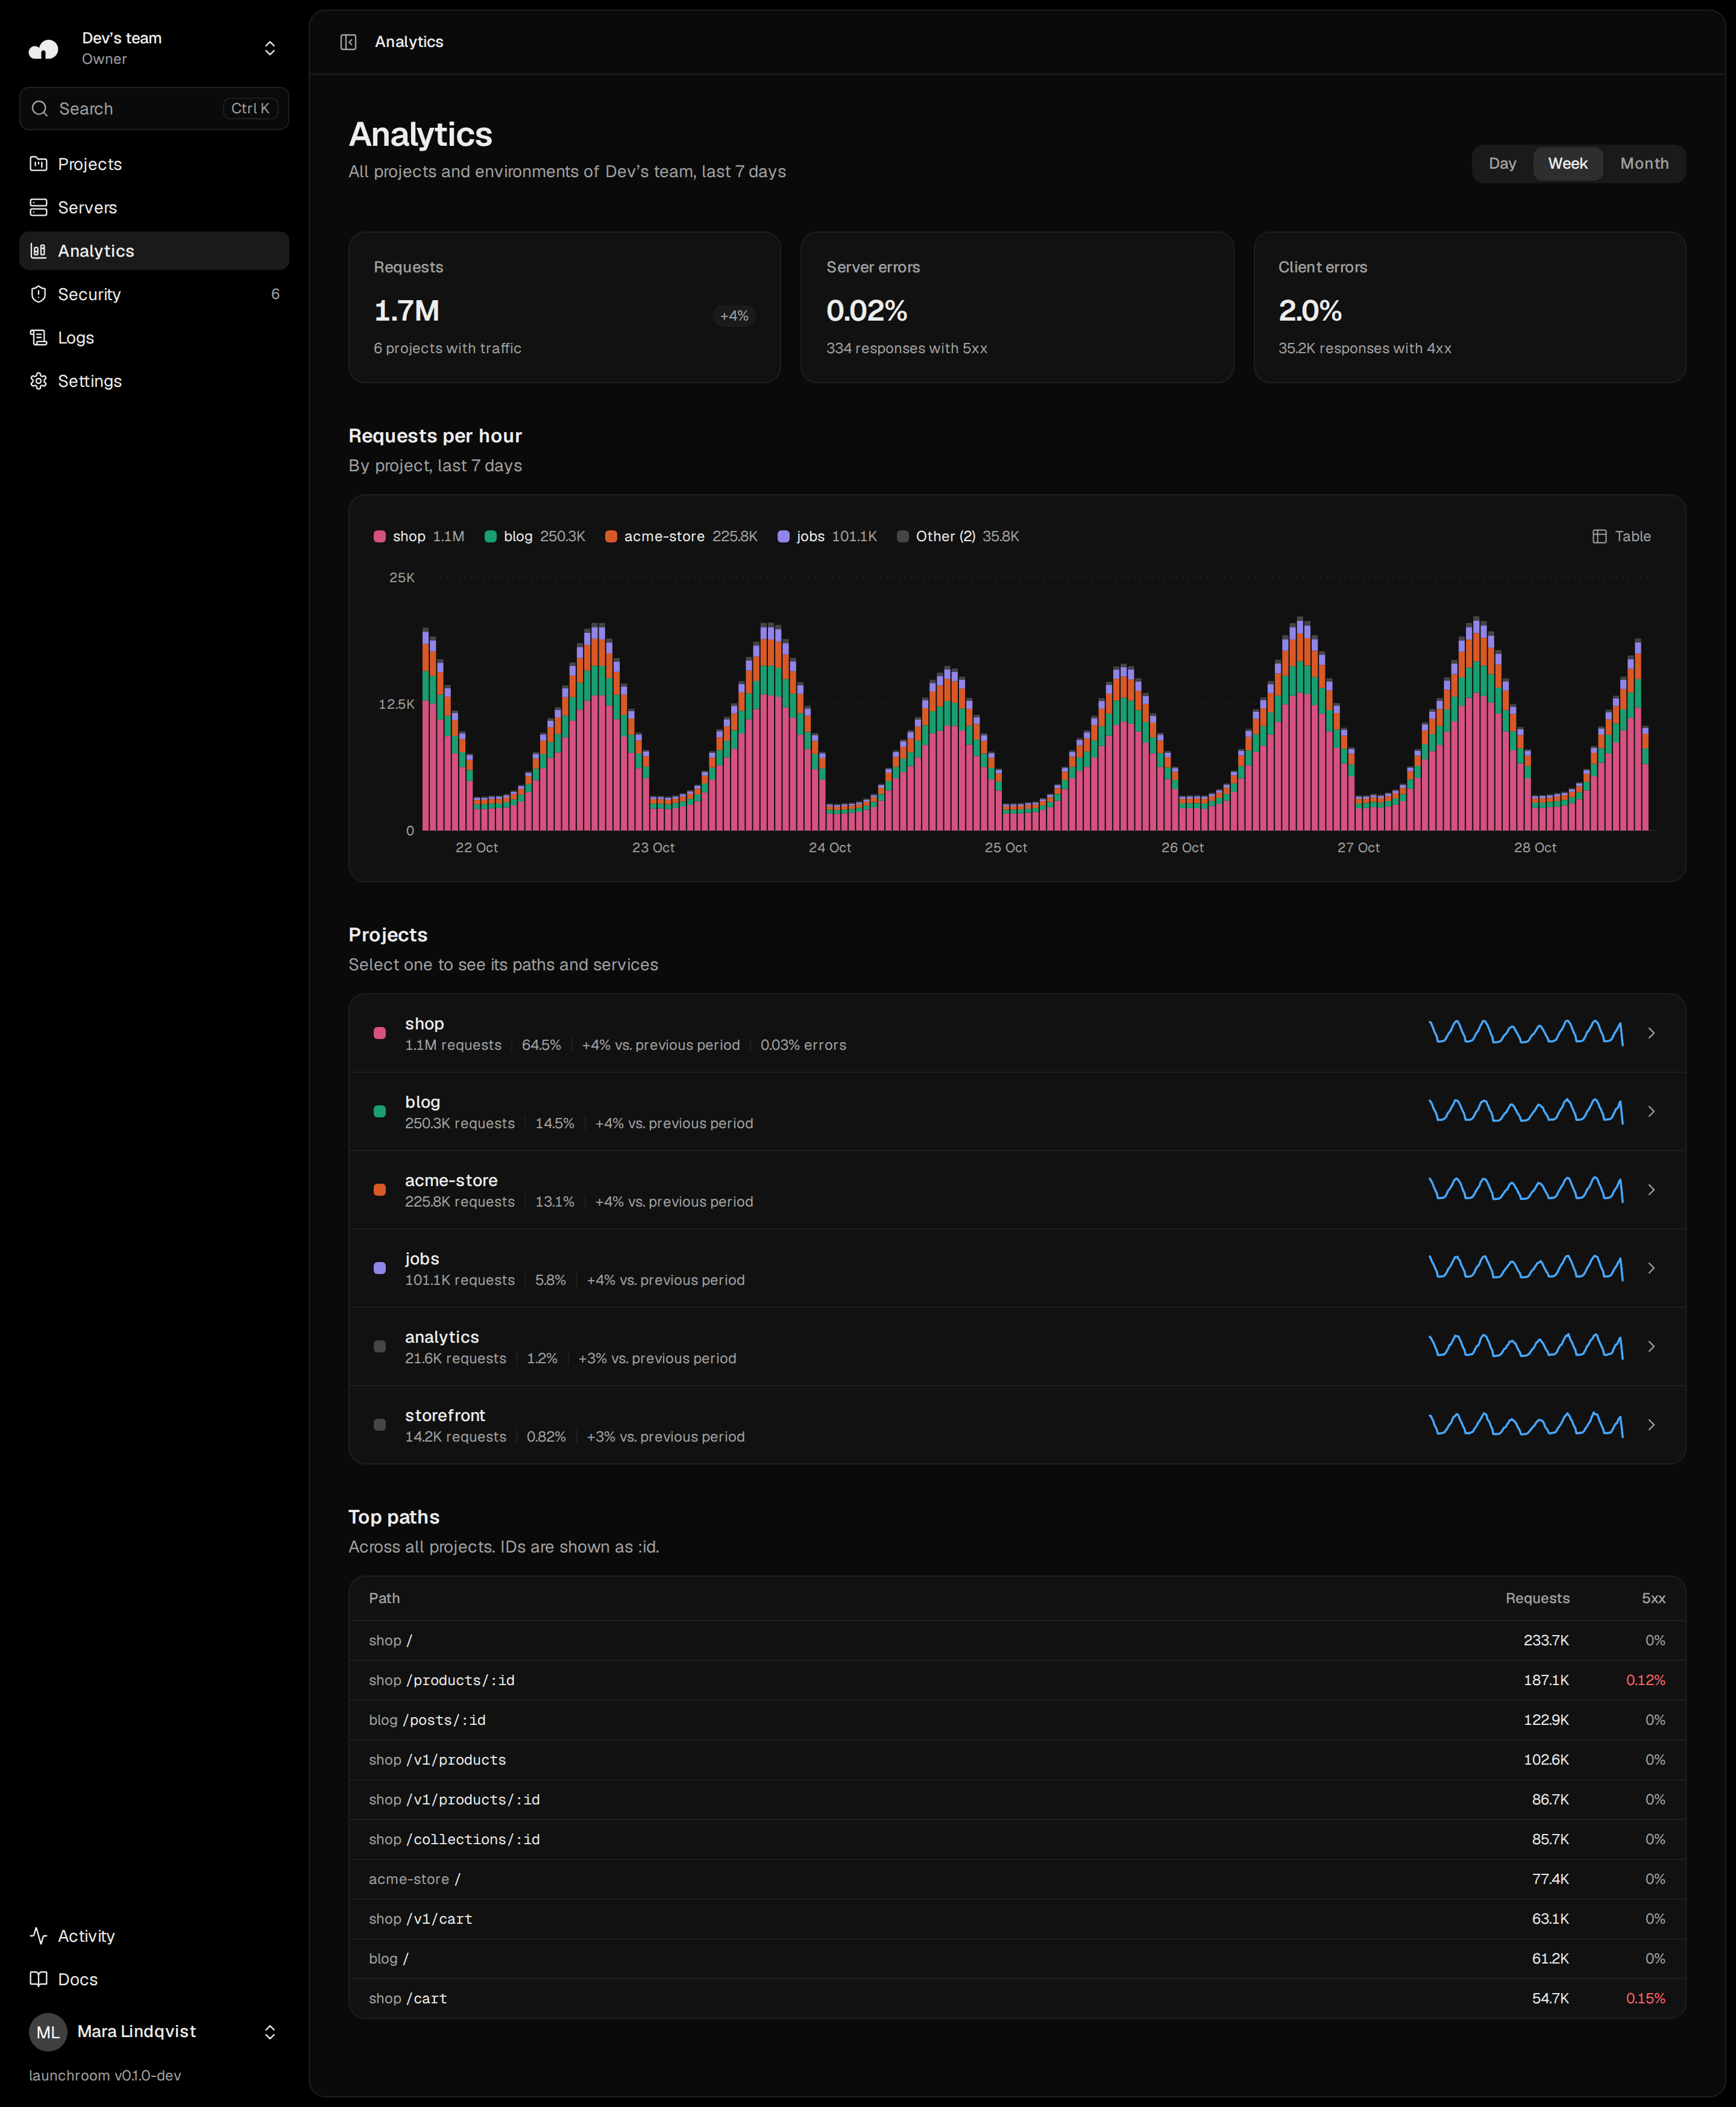
Analytics in the sidebar adds up every project of your team. Select one to see its paths, then a service.
  • Requests per hour stacked by project
  • Share, change and error rate per project
  • The busiest paths across all projects
  • A 24-hour chart on every project card
Analytics
Team analytics for the last 7 days: 1.7M requests across 6 projects, requests per hour stacked by project (shop, blog, acme-store, jobs and other), one row per project with its share, change and a sparkline, and the top paths across projectsTeam analytics for the last 7 days: 1.7M requests across 6 projects, requests per hour stacked by project (shop, blog, acme-store, jobs and other), one row per project with its share, change and a sparkline, and the top paths across projects

Metrics

Latency and errors next to every deploy.

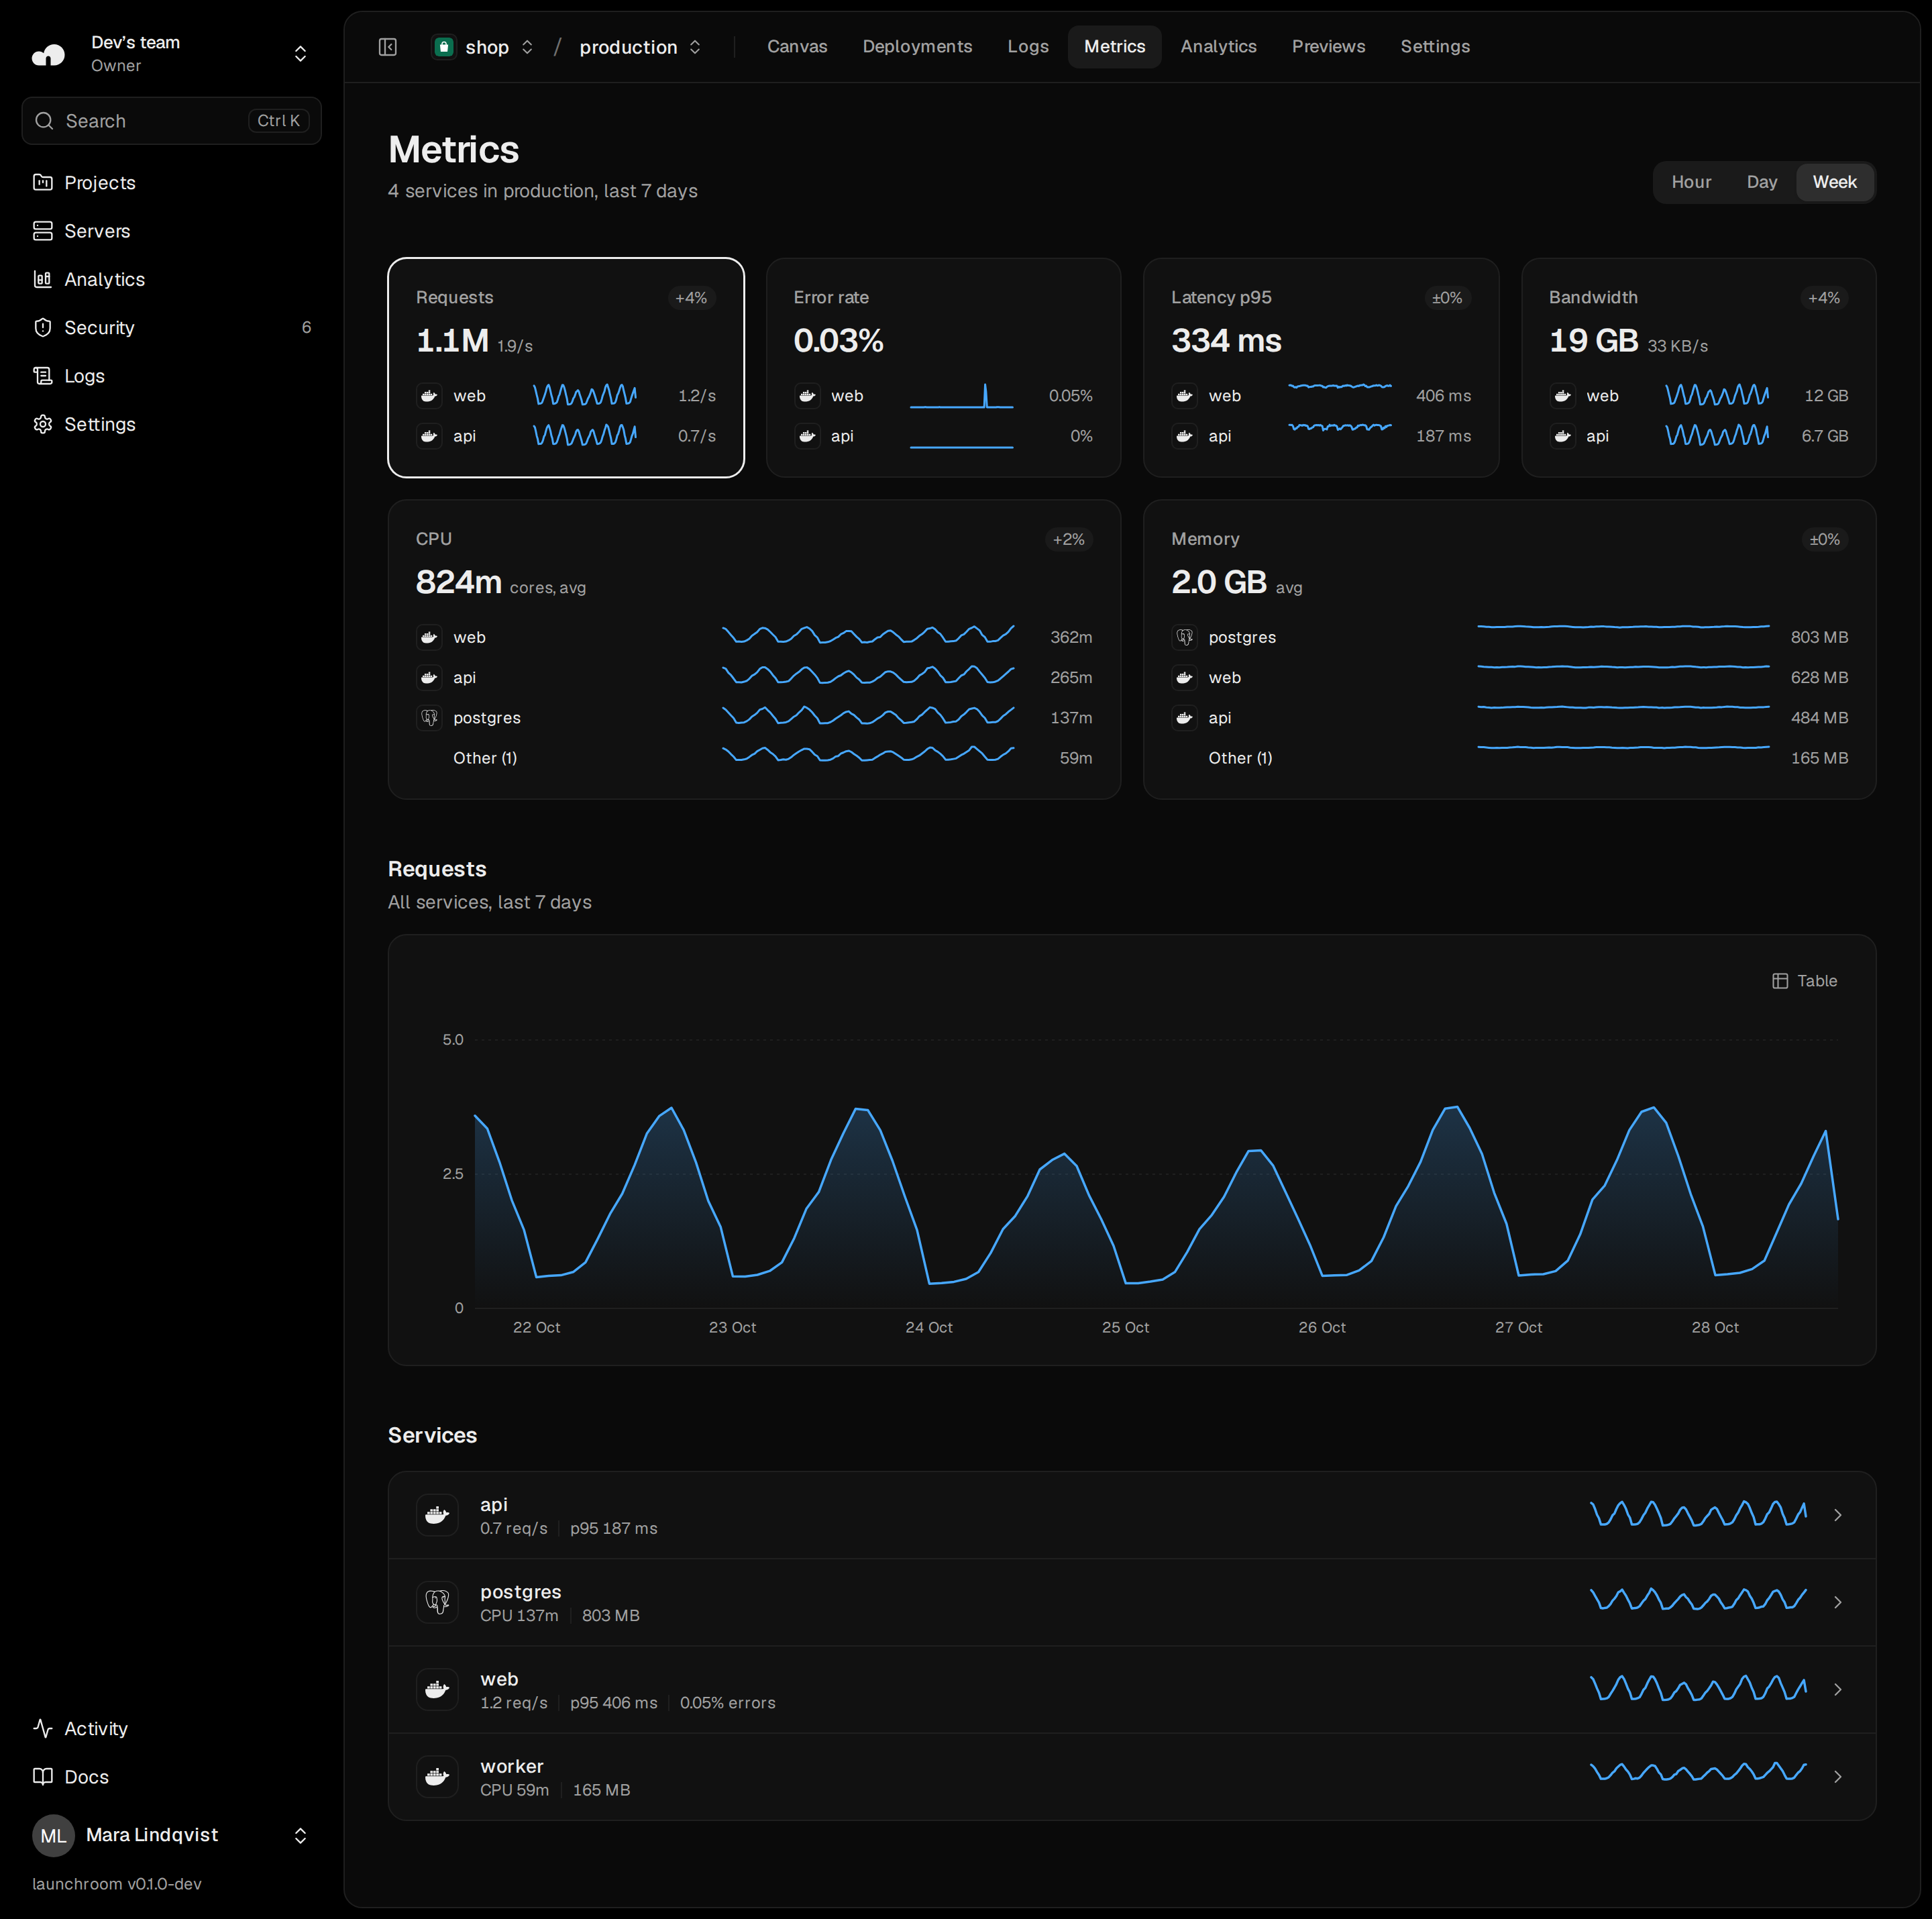
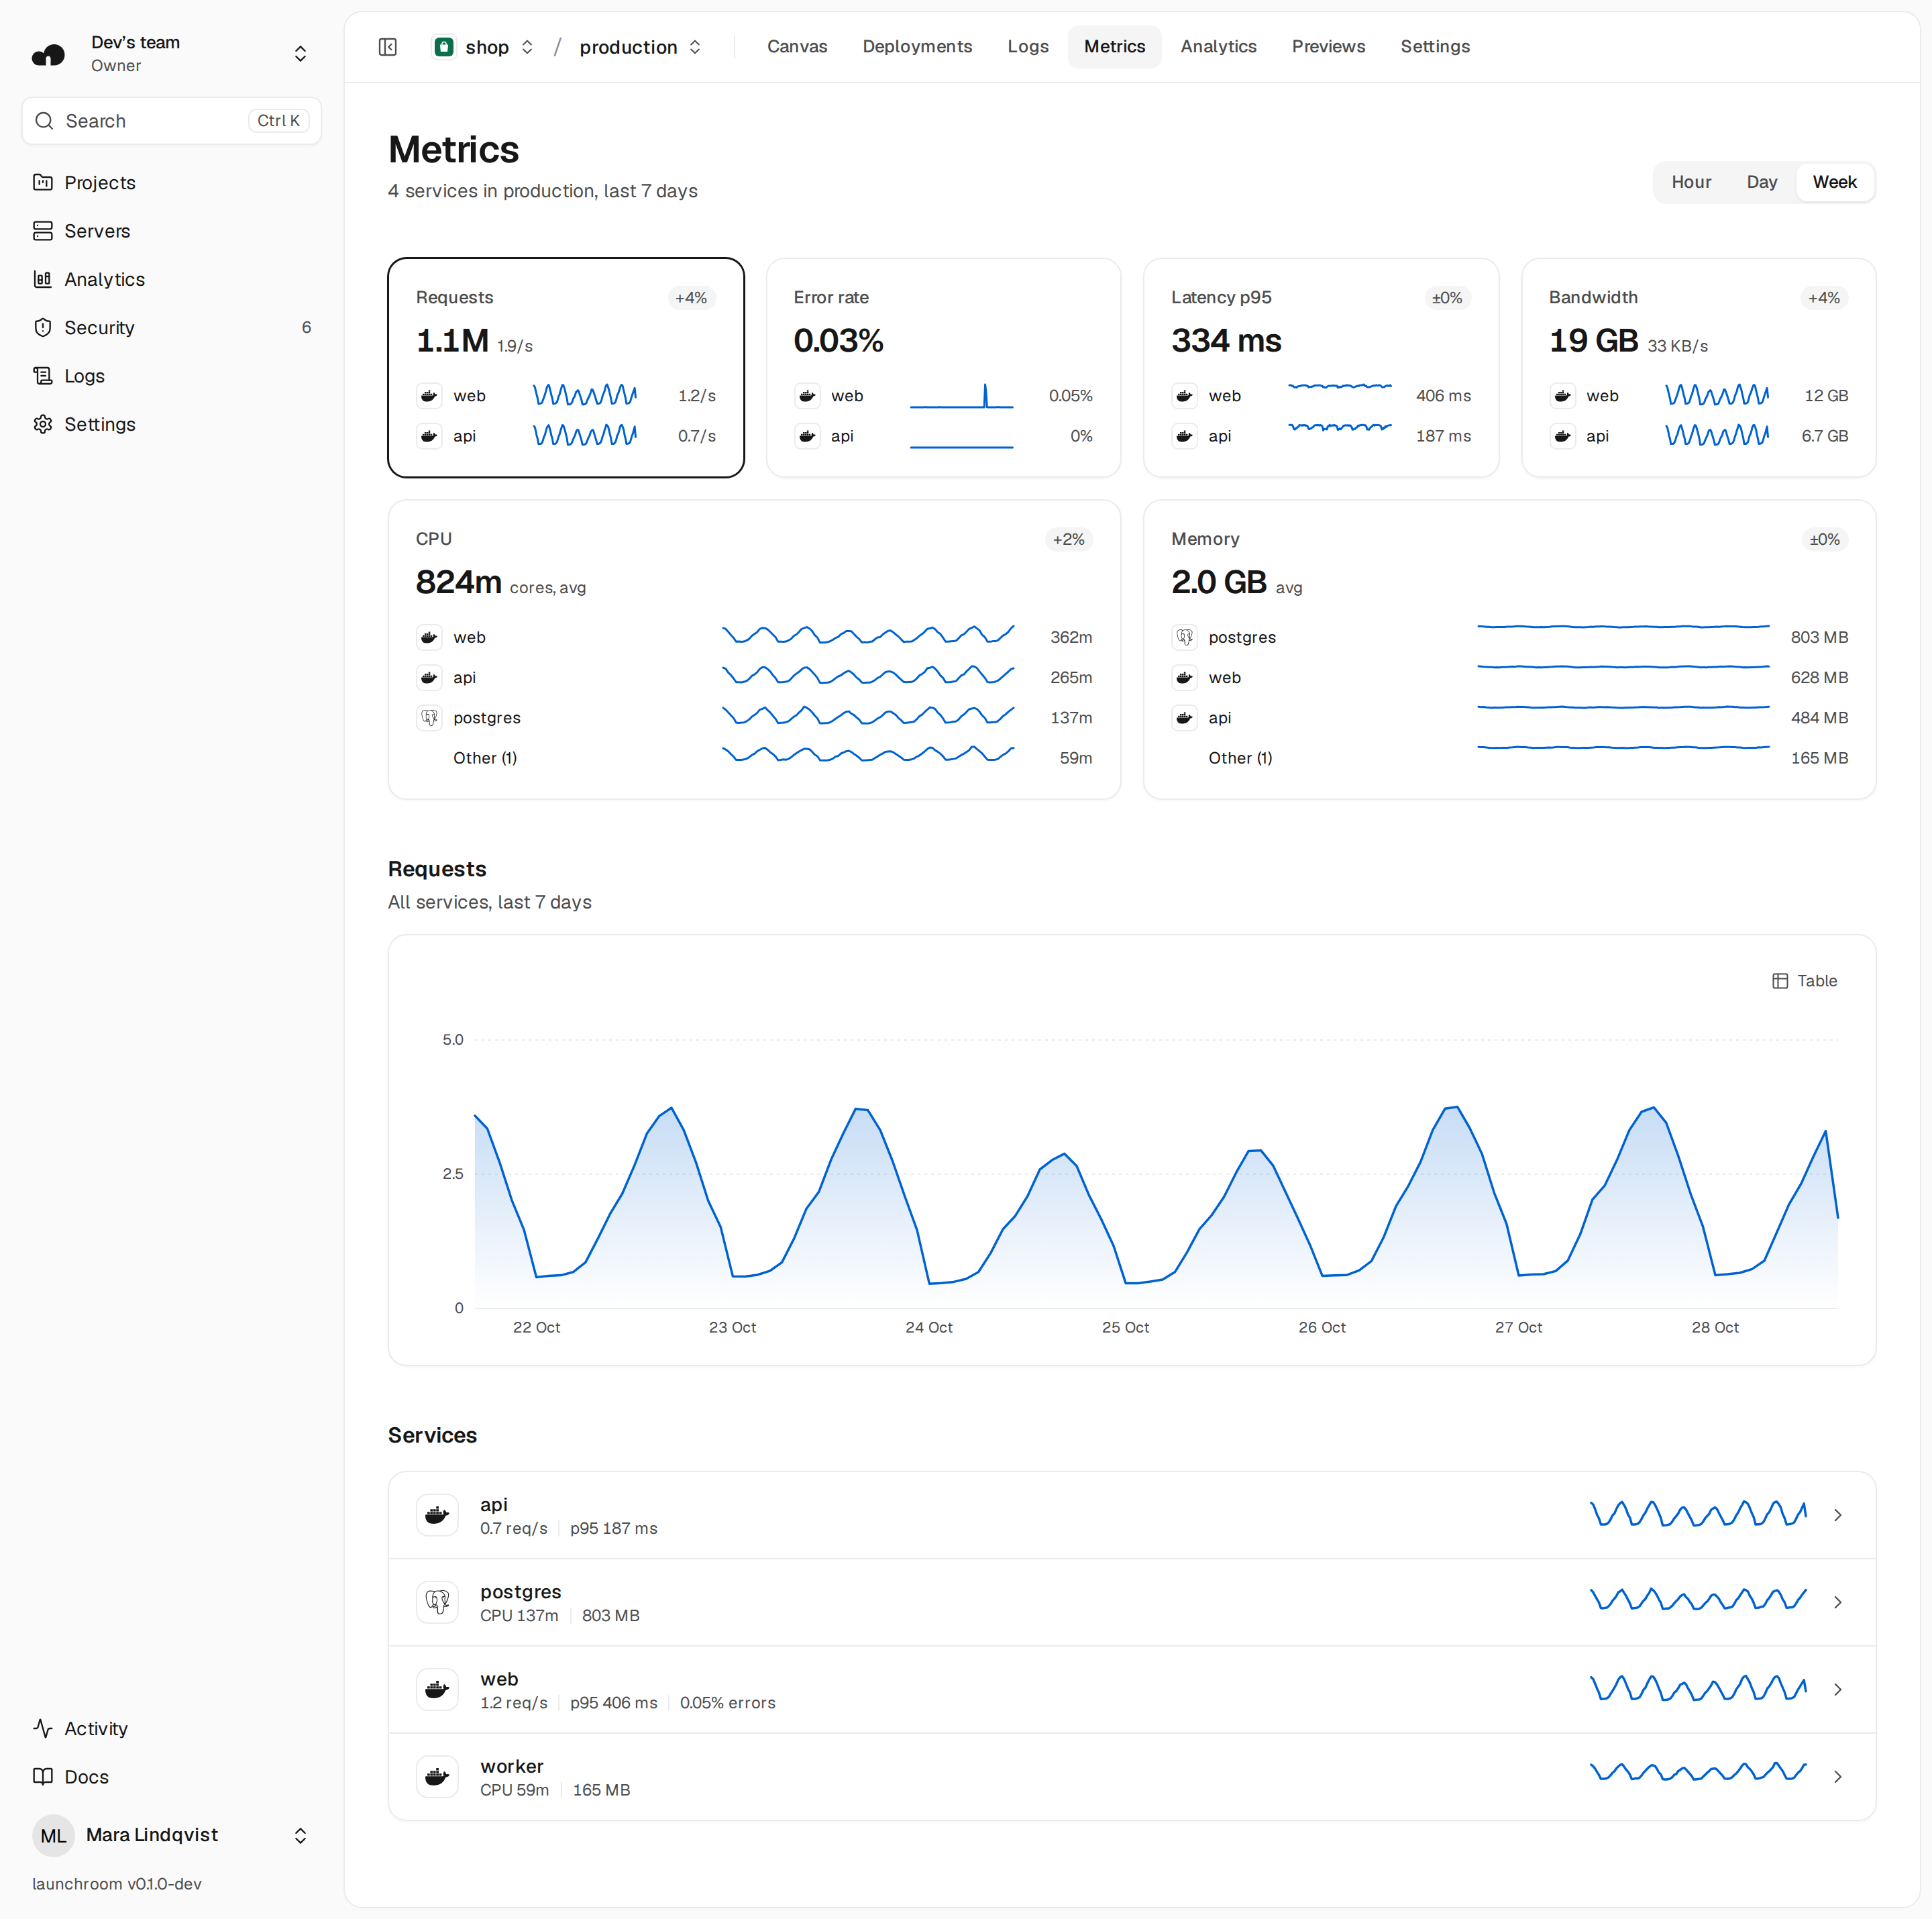
The Metrics tab shows how a service behaves: latency, errors and resources, with the deploy that came before a change.
  • Requests, status codes, latency percentiles and bandwidth per route
  • CPU and memory per service and replica
  • A marker for every deploy on every chart
Metrics
Metrics for shop production over a week: requests, error rate, p95 latency and bandwidth tiles with per-service sparklines, CPU and memory by service, a requests chart with deploy markers, and a services list.Metrics for shop production over a week: requests, error rate, p95 latency and bandwidth tiles with per-service sparklines, CPU and memory by service, a requests chart with deploy markers, and a services list.

Servers

All the load, in one view.

The servers page shows the combined load of your servers, where they are and how they connect. Each server page lists the services running on it with their CPU and memory.


Logs

One search across every service.

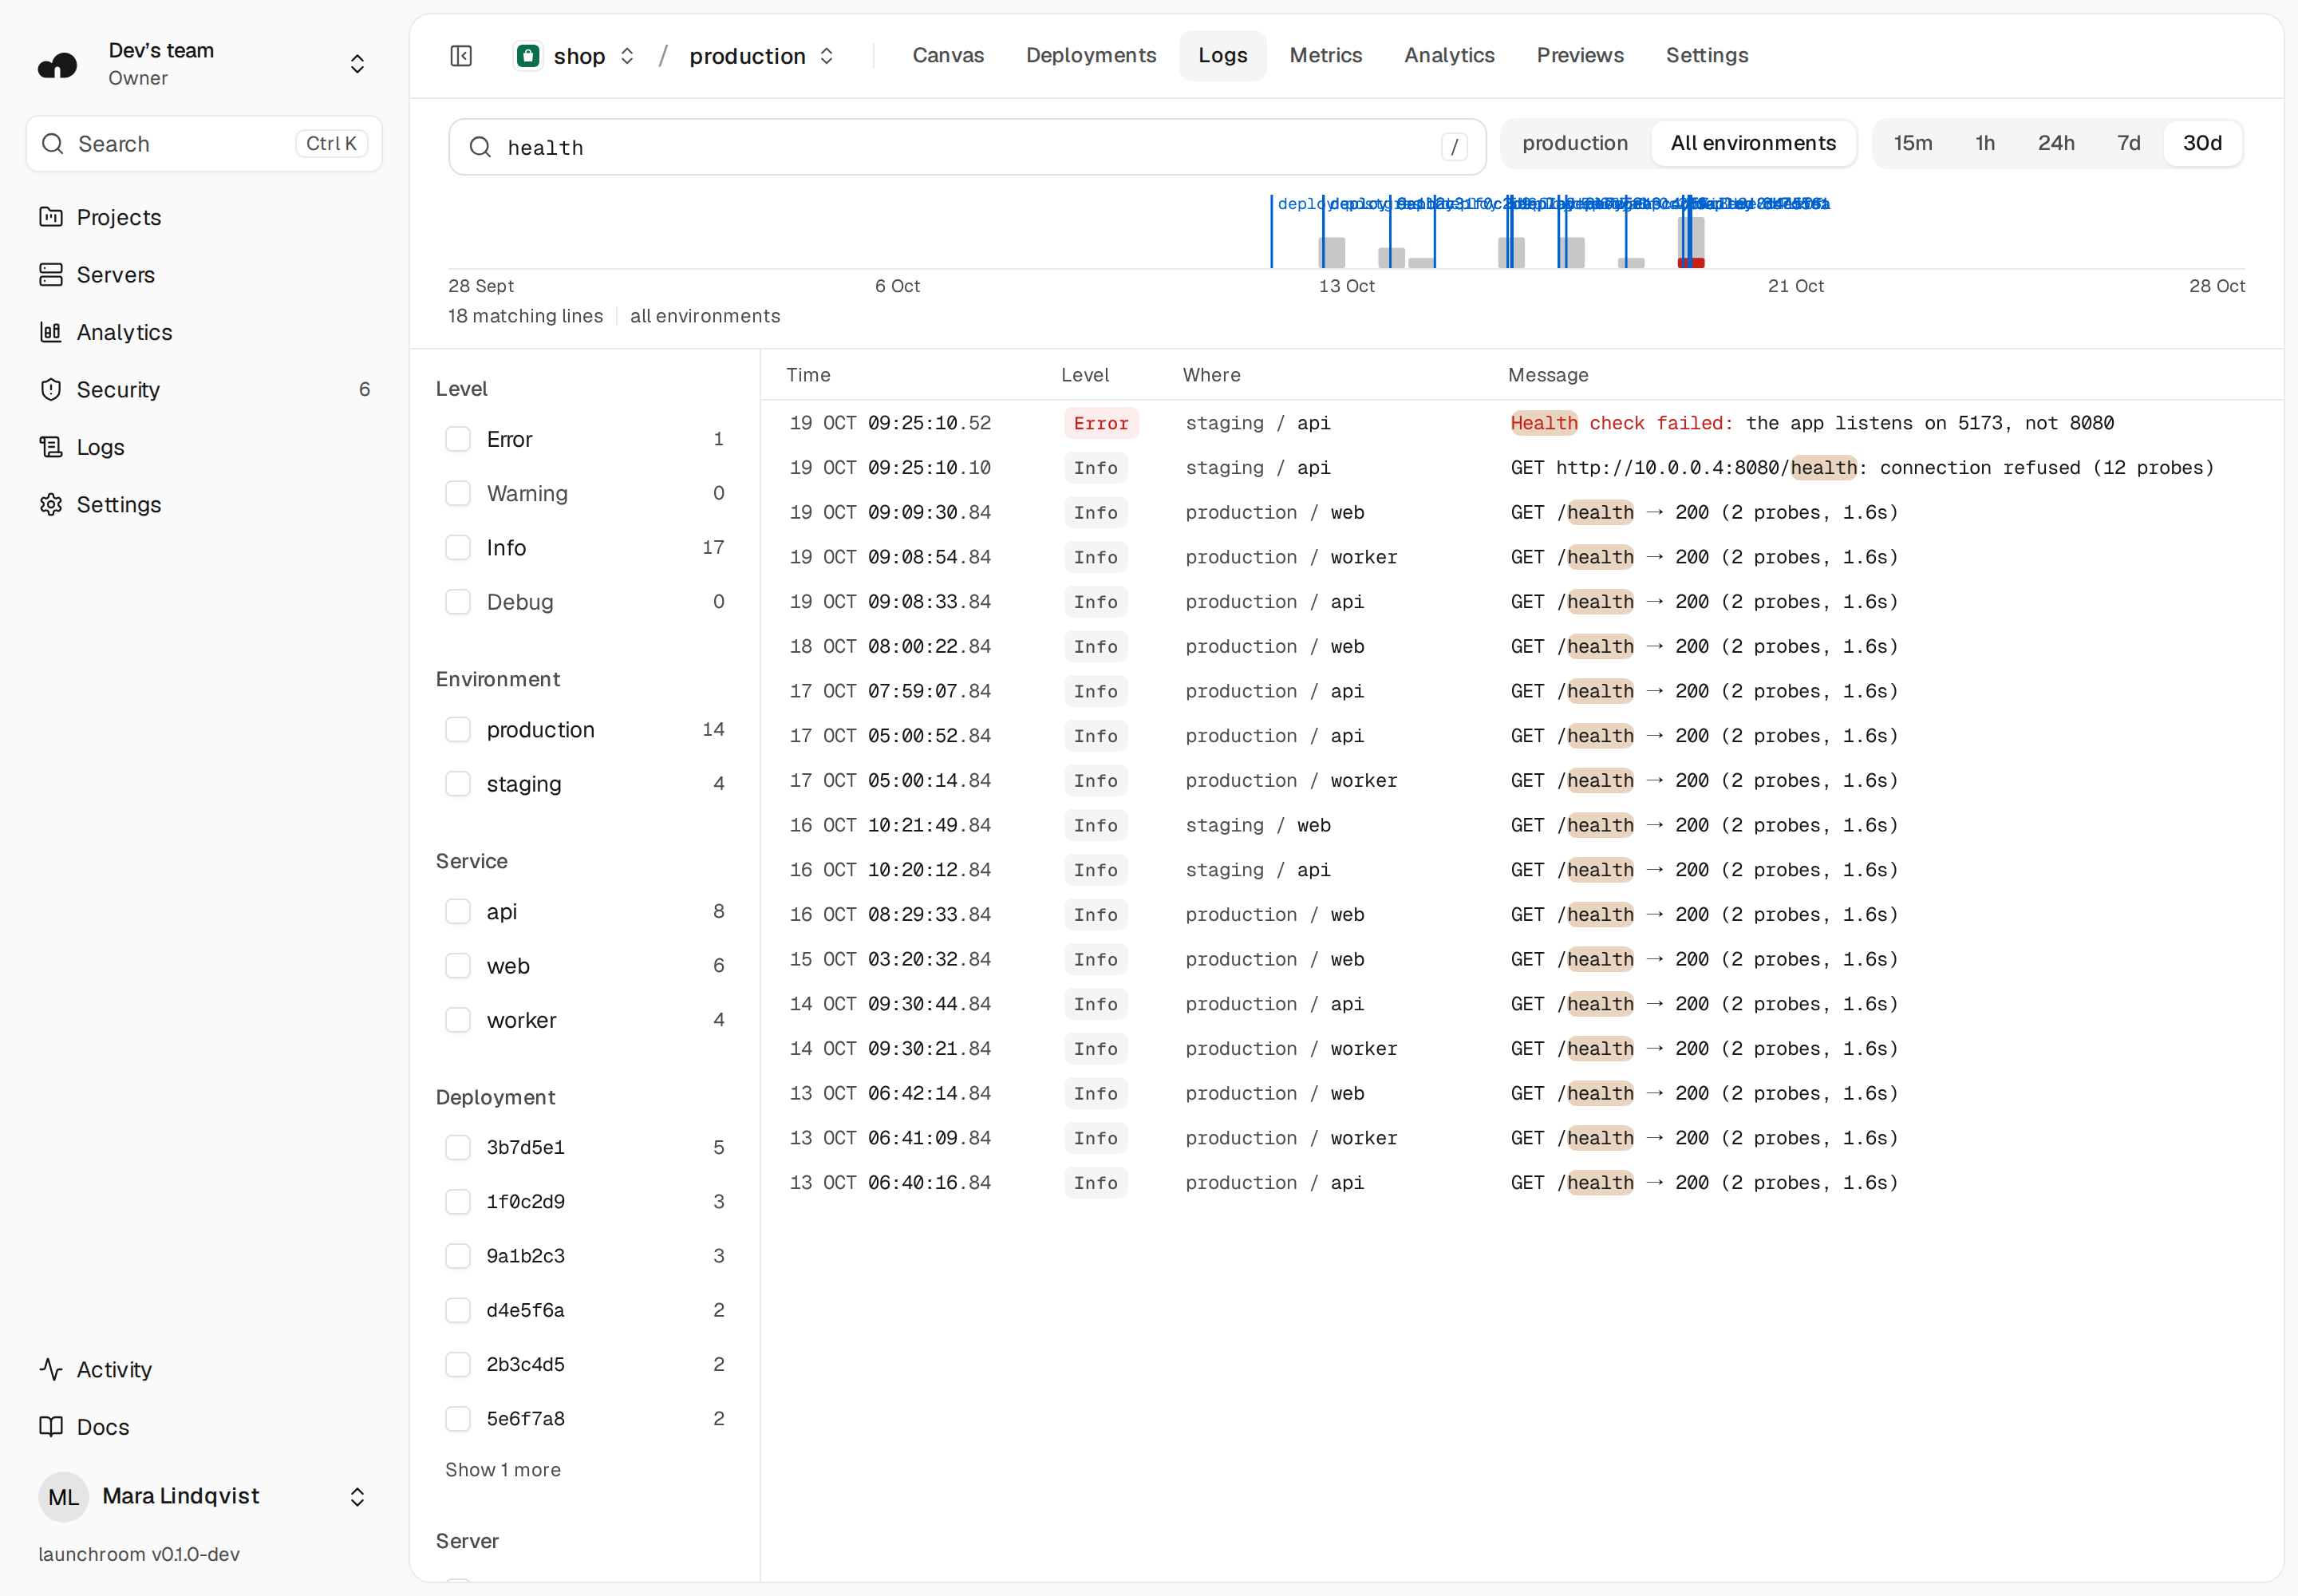
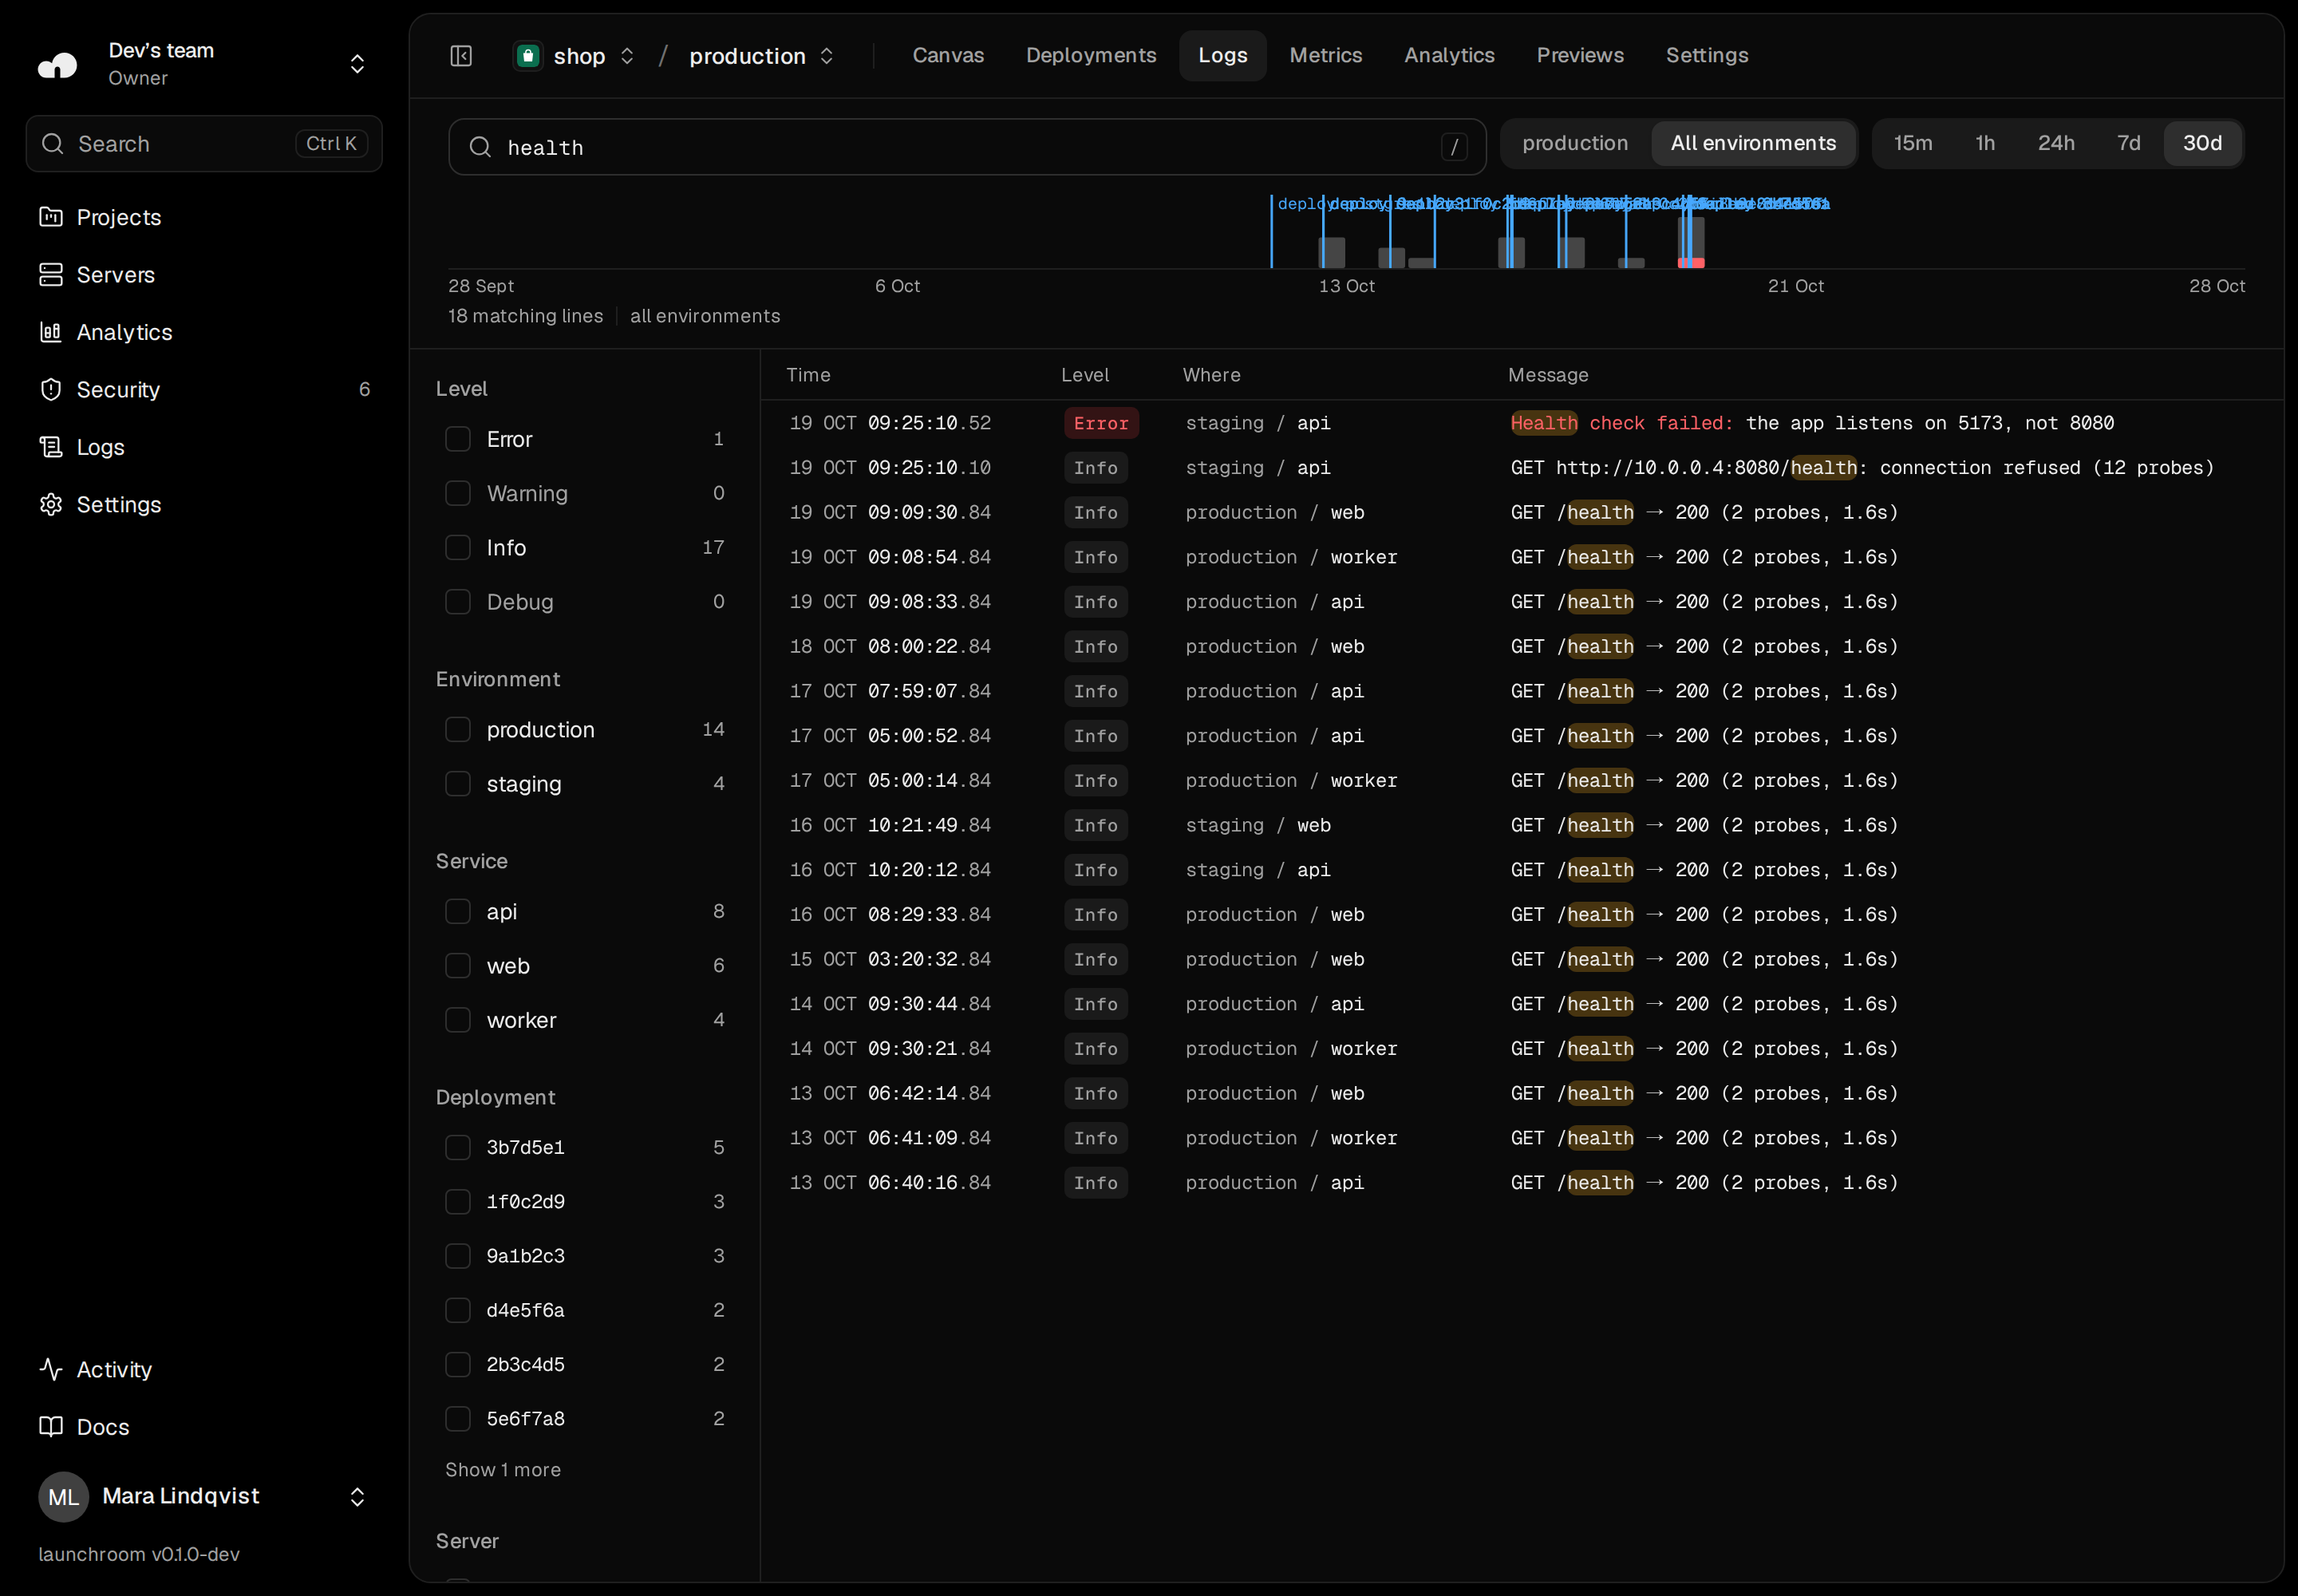
Search a project, an environment or the whole team. The histogram shows when errors started, and the deploy marker next to it shows which release came before.
  • Build and runtime logs, live or from the past
  • A histogram with deploy markers, filters by level, service and environment
  • Retention you choose per environment
Logs
Logs for the shop project searching 'health' across all environments over 30 days: a histogram with deploy markers, facets for level, environment, service and deployment, and matching lines with the term highlighted, including a failed health check.Logs for the shop project searching 'health' across all environments over 30 days: a histogram with deploy markers, facets for level, environment, service and deployment, and matching lines with the term highlighted, including a failed health check.

Alerts

Hear about it where you work.

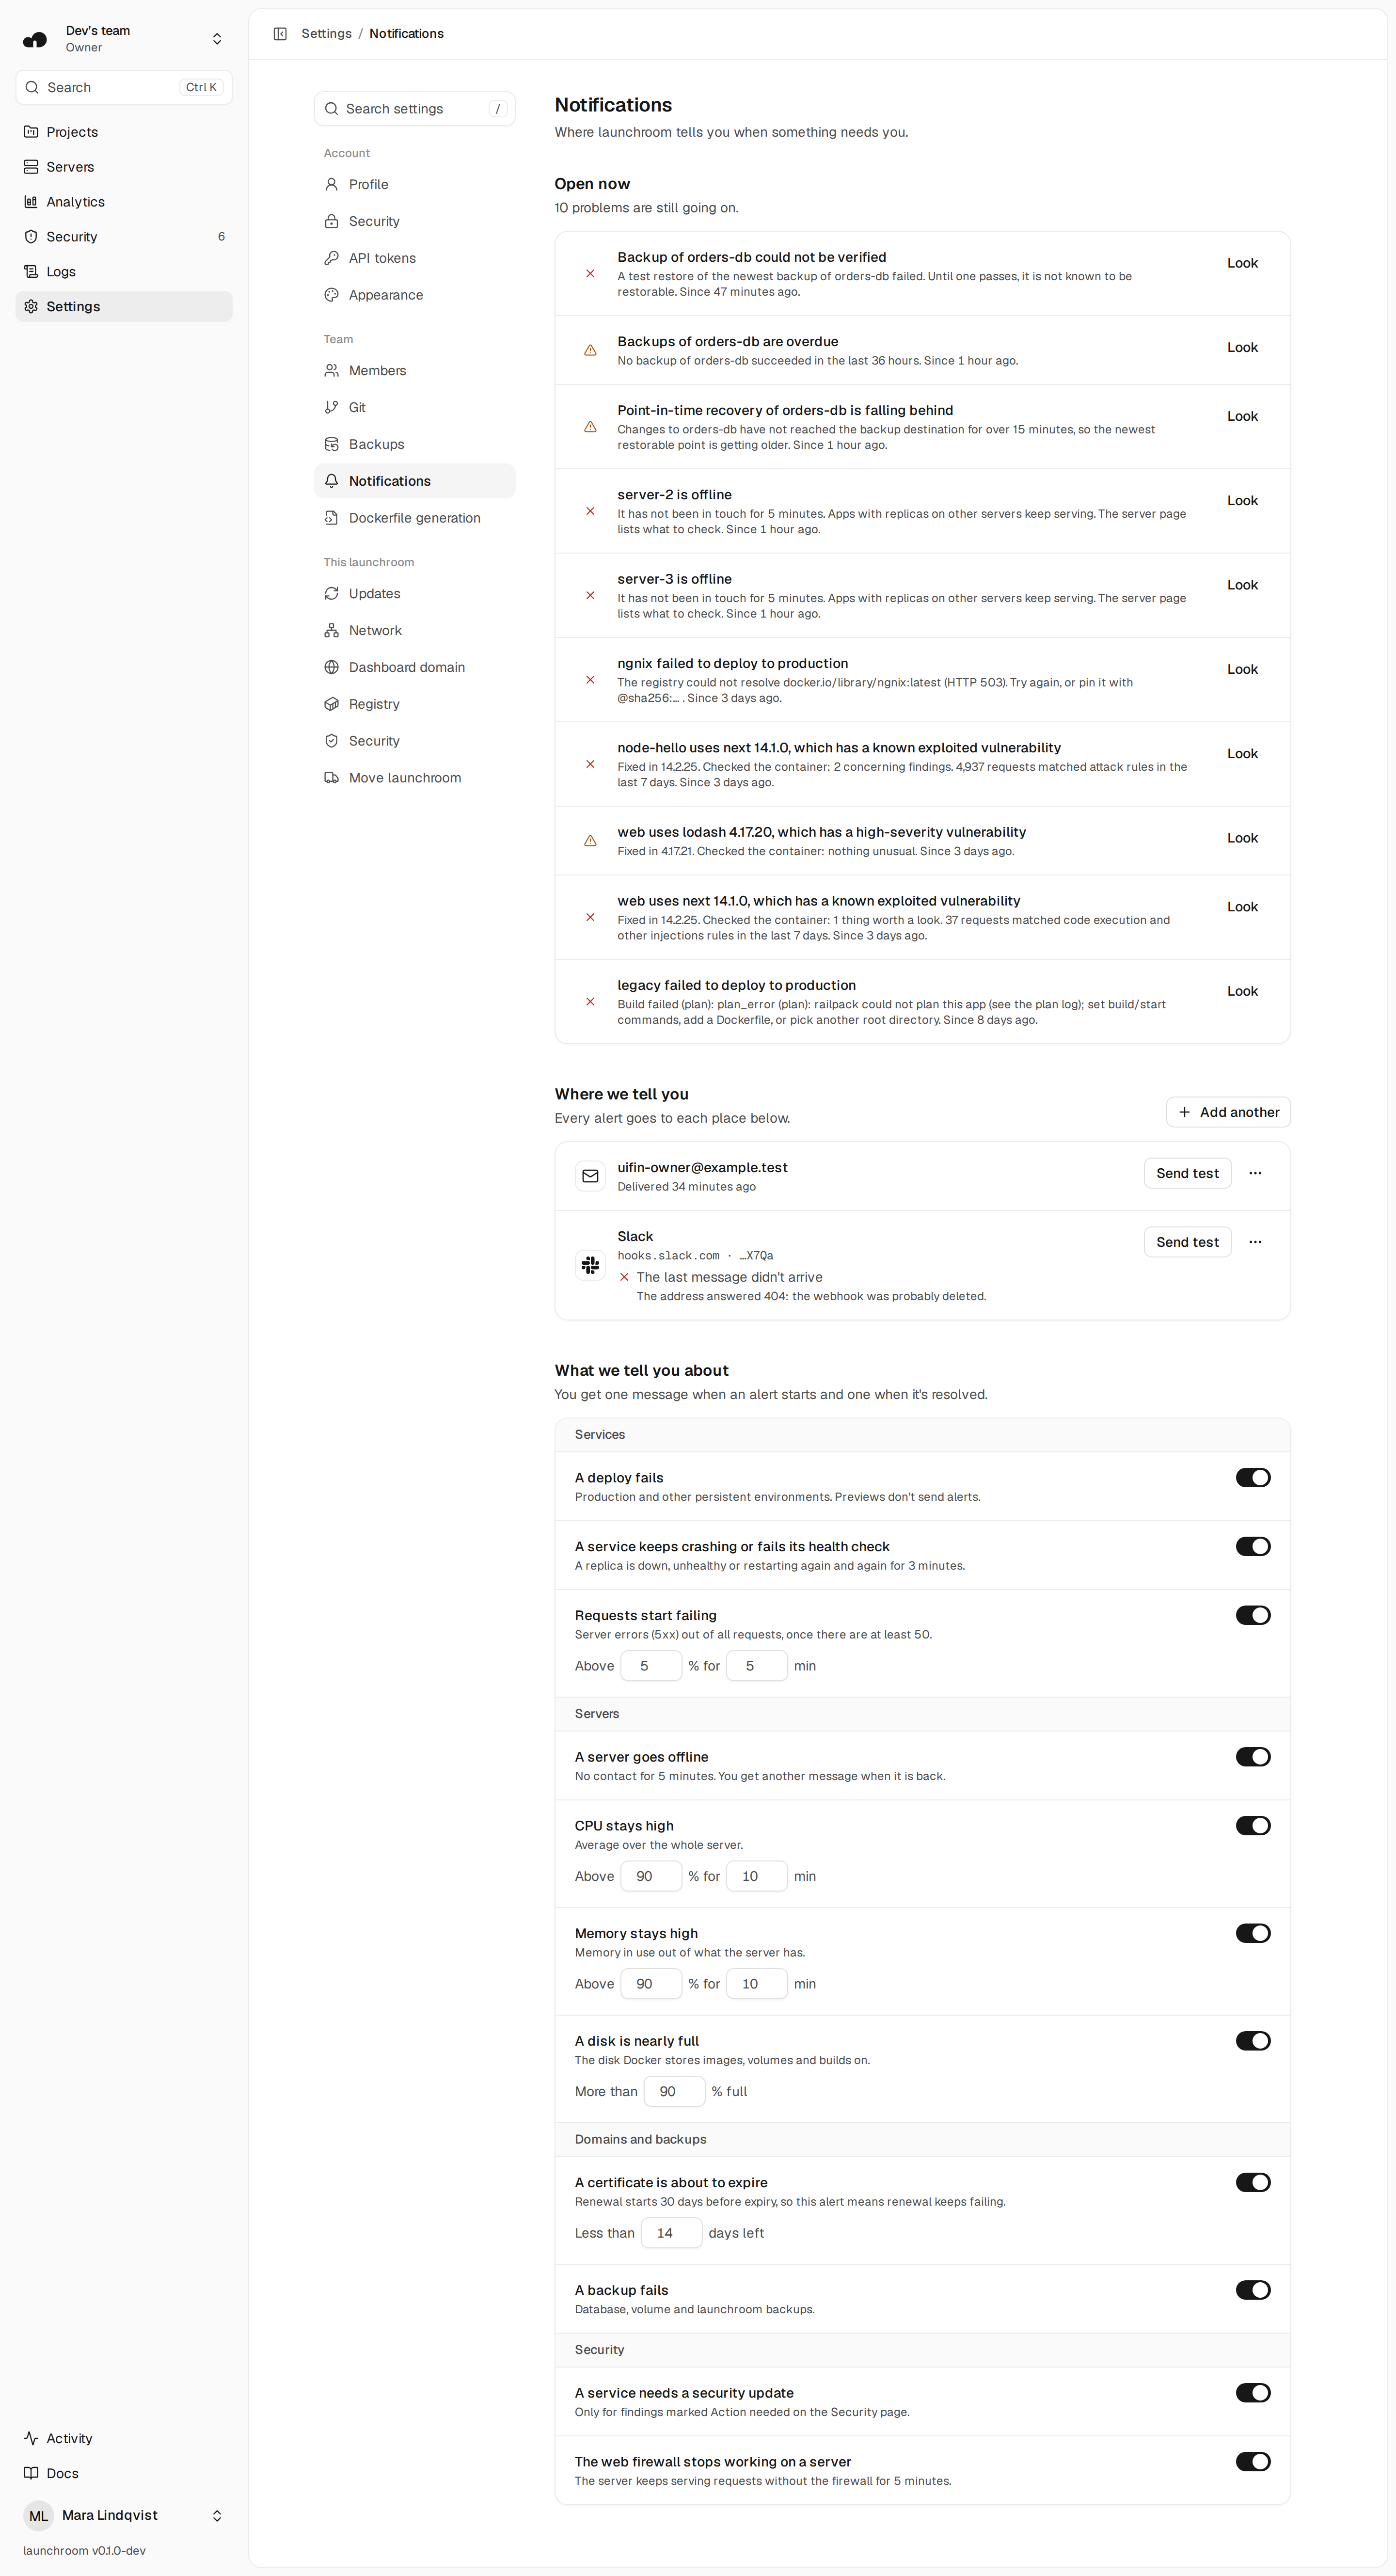
Set the thresholds once per team. launchroom sends one message per problem and one when it is resolved.
  • Failed deploys, unreachable servers, error rates, full disks, failed backups
  • Vulnerabilities that need action and a web firewall that stopped
  • Email, Slack, Discord and signed webhooks
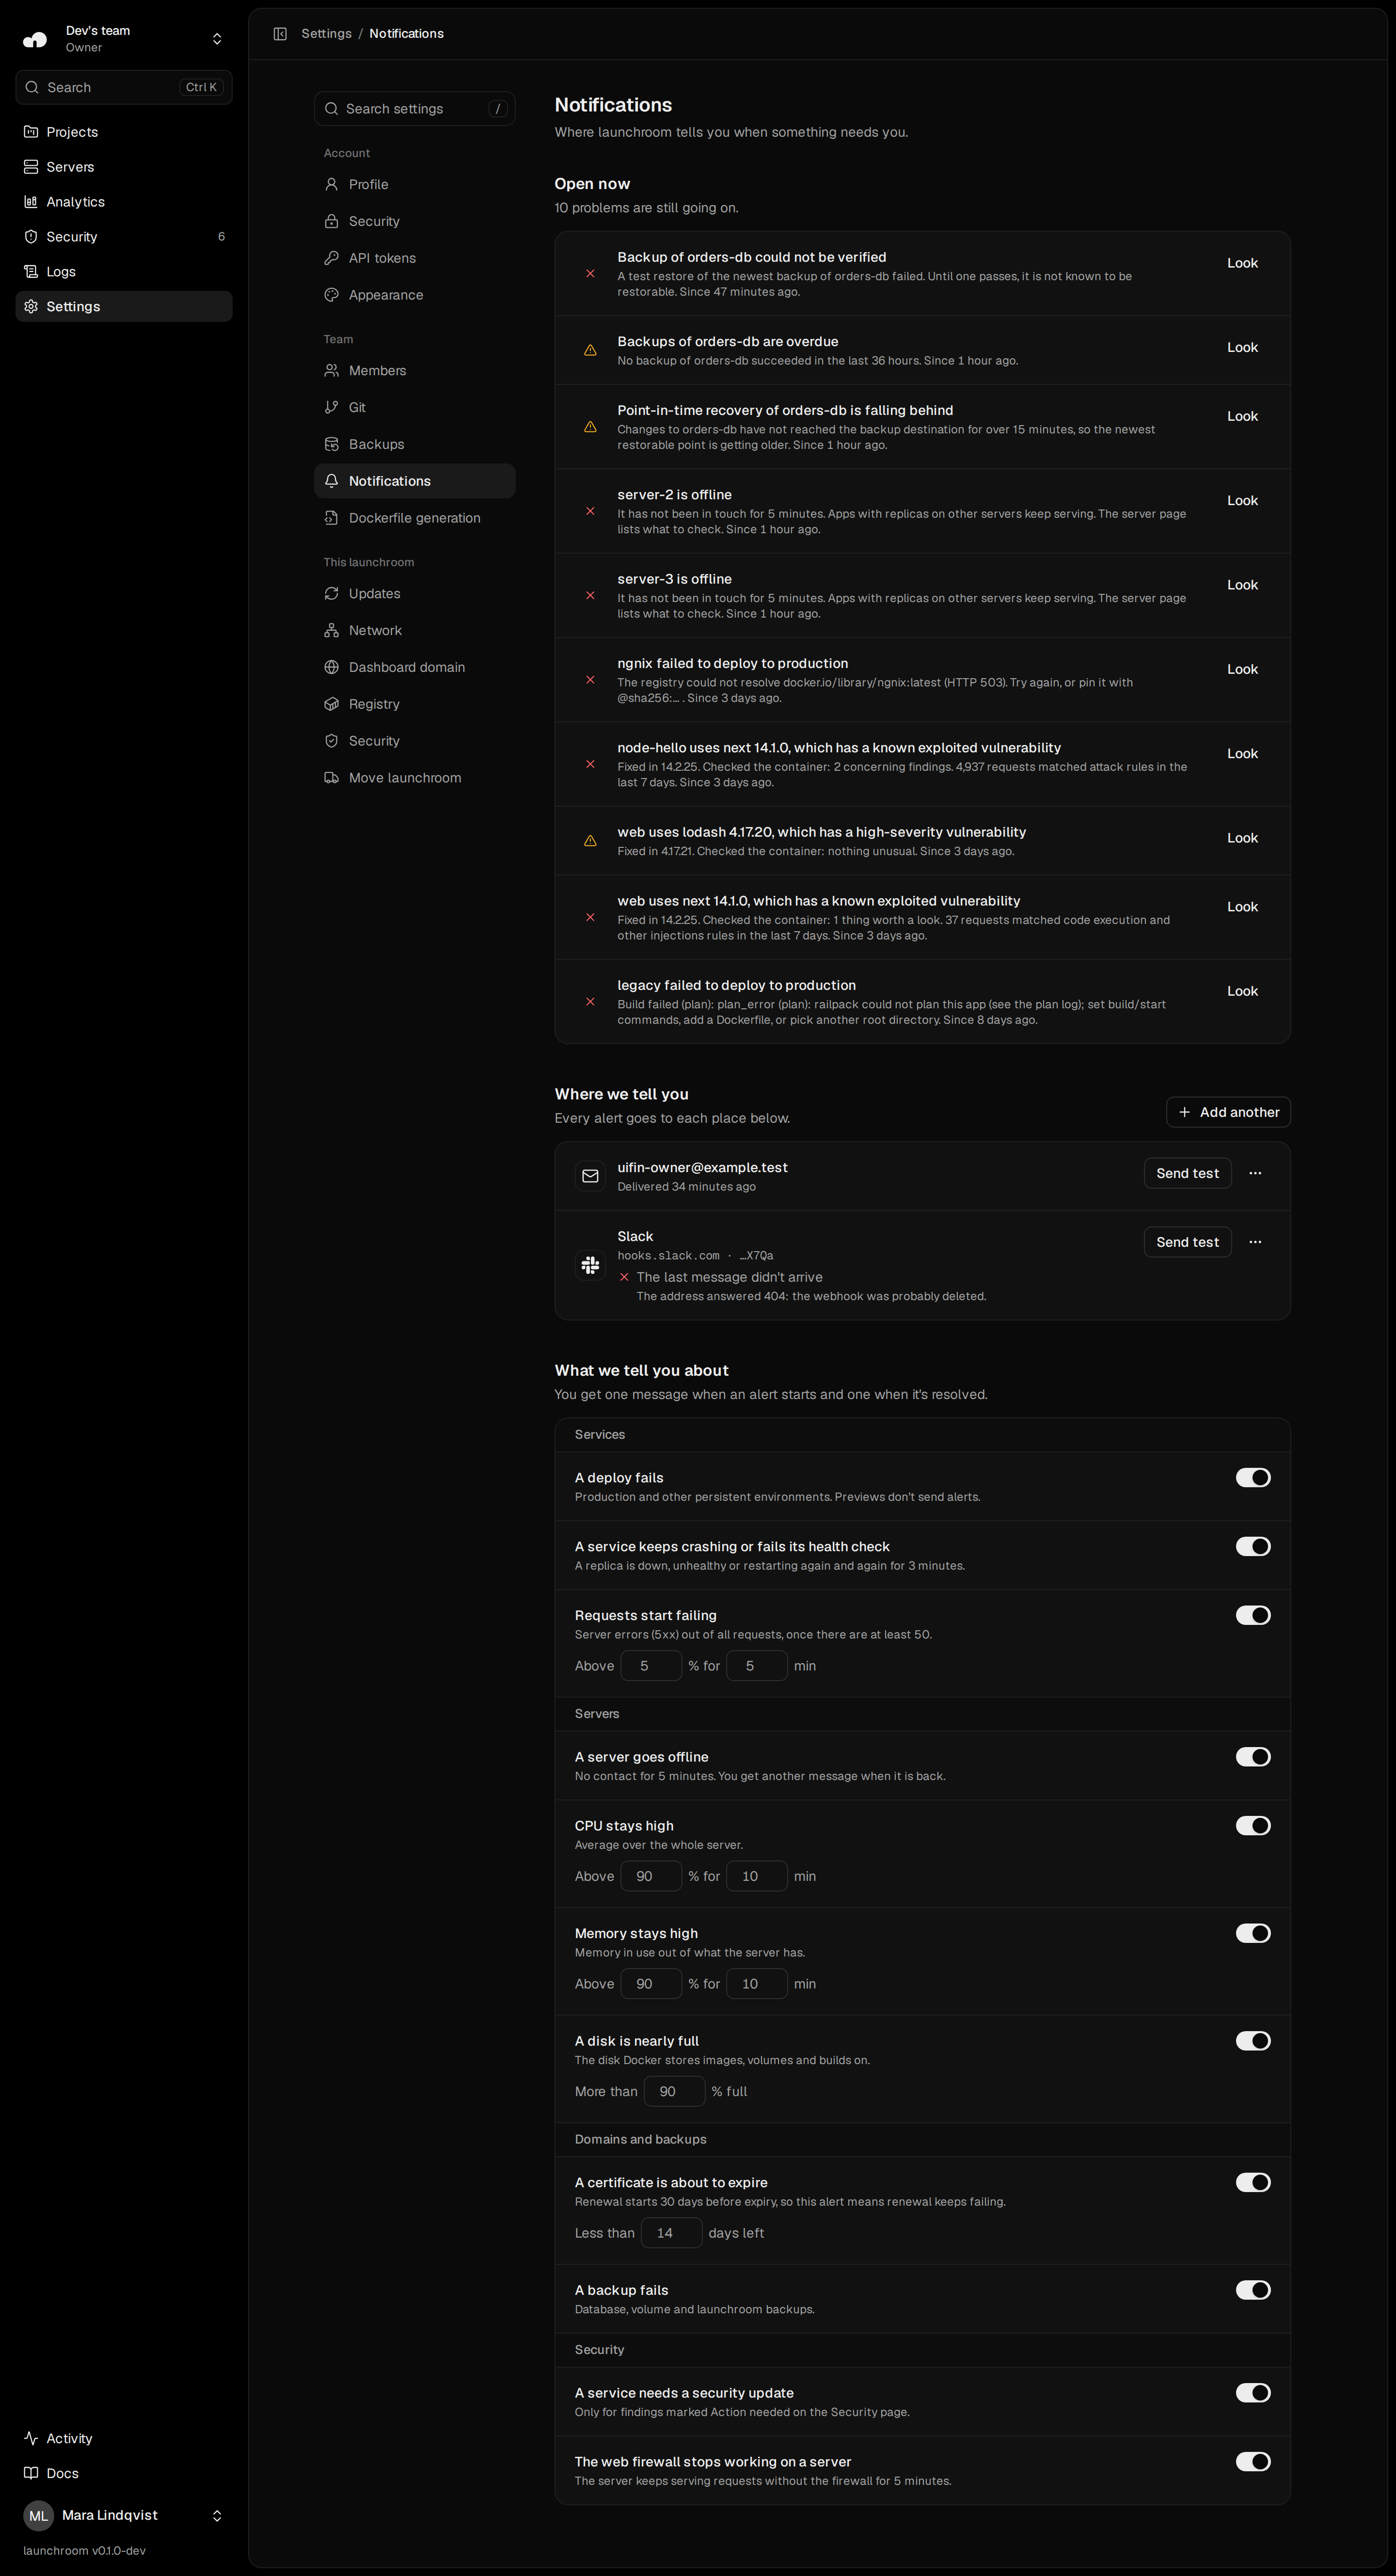
Alerts
Notifications settings: open problems such as vulnerable packages and failed deploys and backups, email and Slack destinations with Send test, and alert rules for failed deploys, crashing services, request errors, offline servers, high CPU and memory, full disks, expiring certificates, failed backups and security findings.Notifications settings: open problems such as vulnerable packages and failed deploys and backups, email and Slack destinations with Send test, and alert rules for failed deploys, crashing services, request errors, offline servers, high CPU and memory, full disks, expiring certificates, failed backups and security findings.

Console

A shell in a running container, in the browser.

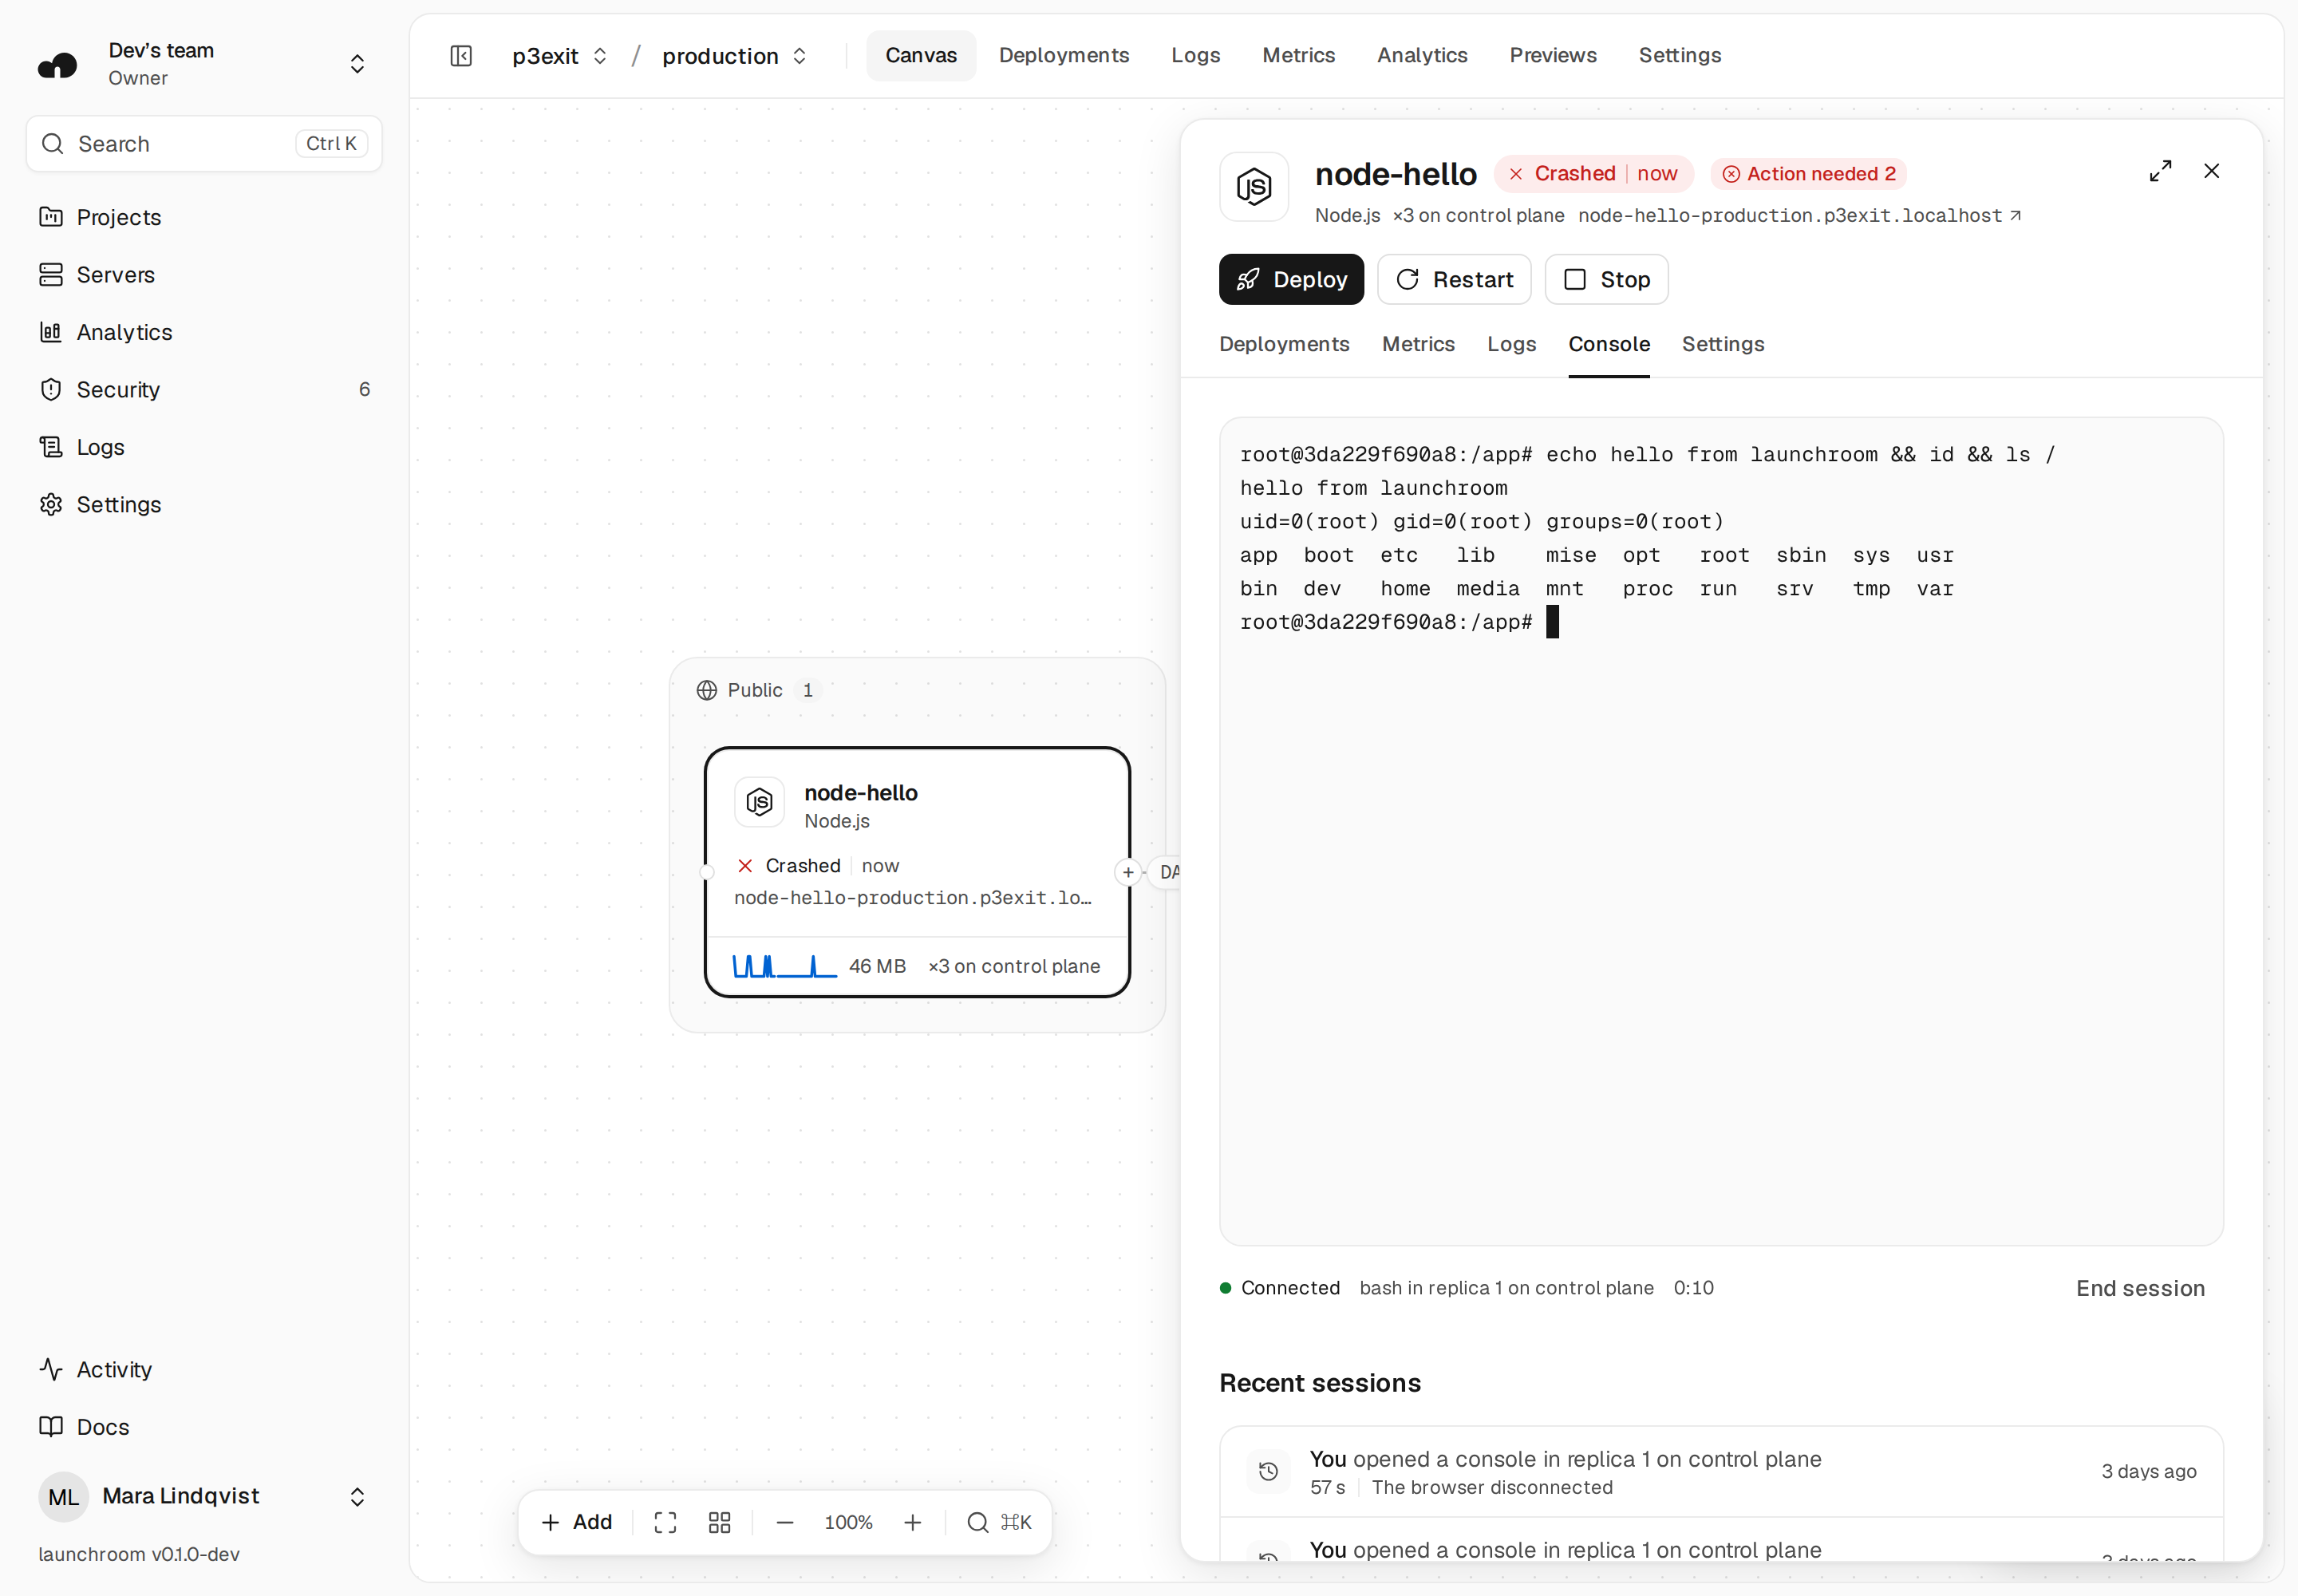
Open a console in any replica as the container’s own user. Sessions are time-limited and recorded in the audit log. There is no shell on the server itself.
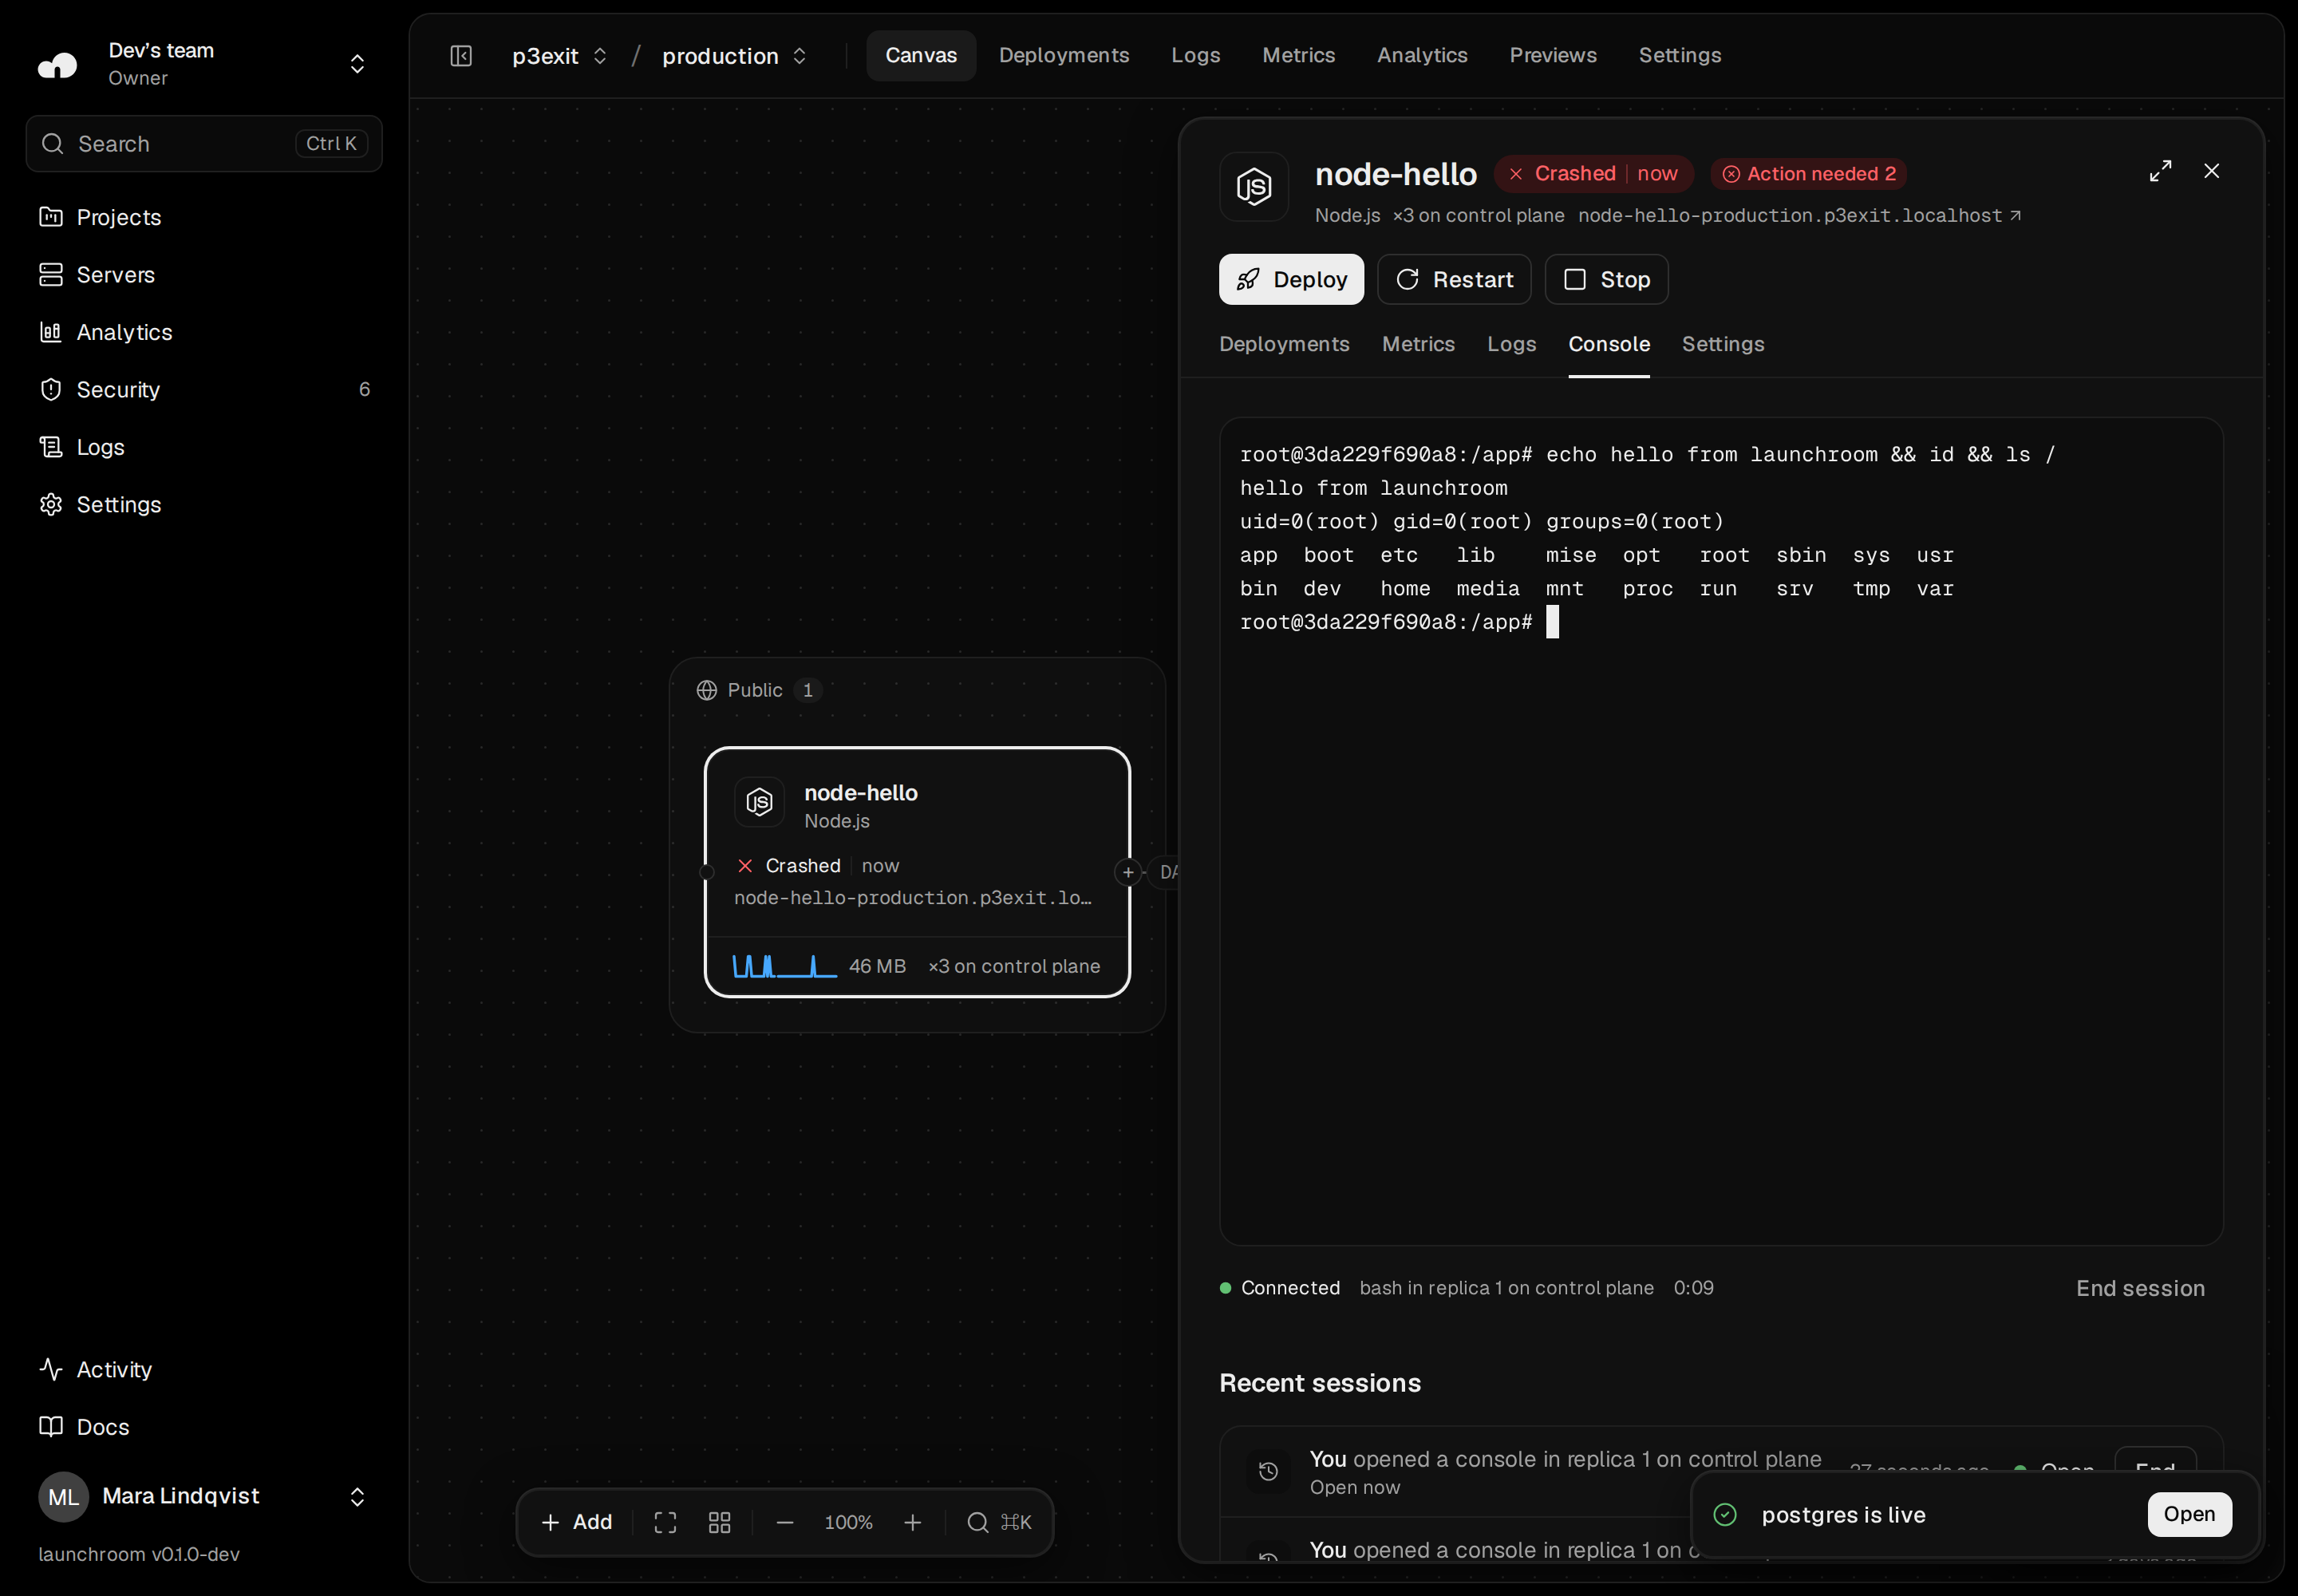
Console and Data
Console tab of node-hello: a live shell on replica 1 on control plane after running echo, id and ls, with session status and a list of recent sessions.Console tab of node-hello: a live shell on replica 1 on control plane after running echo, id and ls, with session status and a list of recent sessions.

Details

Built in
Analytics, metrics and logs run on your server. No external service, no extra container.
Kept as long as you need
Paths and referrers hourly for 7 days and daily for 90 days, both configurable.
API
Read the analytics of the team, an environment or a service with an API token.
Link quality
Latency and bandwidth between every pair of servers.
Activity
Deploys, promotions and changes in one timeline.
CLI
Follow logs from your terminal or CI with the launchroom CLI.

Install it on your server with one command.

curl -fsSL https://launchroom.vantezzen.io/install | sh